On reflection, Slack Investor had it relatively easy on his path to financial independence. All he had to do was maintain a reasonable ‘savings rate’ of his net salary – and put these savings into appreciating assets like superannuation, housing, or a share portfolio. This ‘savings rate’ is fundamental to how many years it will take you to reach financial independence. It is worth showing this chart again to concentrate the mind.
From The Escape Artist – using the conservative assumption of a 5% return on your retirement portfolio after inflation. The savings rate is on the bottom axis and the number of years to retirement on the Left and also marked on the blue line.
Slack Investor’s ‘savings rate’ was, over his disciplined working years, between 20% and 45% and included superannuation contributions. He tried to automate this as much as possible by having deductions from his salary into things like extra superannuation contributions and home loan repayments. There is no doubt that heroic savings rates are now even tougher to maintain.
Paying Back Your Education
For Slack Investor, university education in the 1970’s attracted few fees. Things are different now and most students will carry an increasing financial burden into their working life.
For a median priced Australian home, it takes over 33% of household income to service a loan. This is the highest level since 1990 – when standard home loans peaked at 17.5%!
It is not any easier in the rental markets either. When comparing national median income with national median rent, the percentage of income spent on rent has crept up to 33%. The 20-yr average is 29%.
Despite the increased costs of living, the young have time on their side – and full access to the world-class retirement scheme of Australian compulsory superannuation. The 12% employer contribution rate since July 2025 gives you a base ‘savings rate’ of 12%. Relying just on this, from the chart above, puts you on track to retirement in 45 years – sounds bad, until you realise this is just the base. Any additions to your ‘savings rate’ will rapidly shorten your retirement track.
The best time to invest was yesterday. The second best time is today. Attributed to Warren Buffet
To own your own dwelling in retirement is important. It may be an apartment, place in the country, or a ‘tiny house’ – as long as it’s yours!
Although complete financial independence is the aim – the next achievable step is the ‘sweet spot’ for superannuation savings where there is maximum ‘bang for your buck’ when you combine your super with the age pension.
Using this ‘sweet spot’, Bec Wilson calculates that a single home owner with super savings of $338 000 combined with the age pension and a part-time job ($7800 p.a.) can have a yearly indexed income of $55 923. For couples who are home owners, the ‘sweet spot’ is a combined $512 000 in super.
For home-owning couples, $512 000 in Super combined with the age pension, that’s $70 760 a year in retirement income. Bec Wilson, SMH
There may be hope on the horizon with some levels of government trying to fix the poor incentives that they have created. Slack Investor would like to see a bit more work by governments on the housing supply side. However, there are positive signs – in the fall of house prices due to recent capital gains tax changes and increases in home loan rates. Also, there has been some meetings between the Labor government and the Coalition to try to find consensus on migration guidelines that will limit our net arrivals number until the housing supply catches up. Slack Investor is always the optimist!
Slack Investor has a deep love for the Superannuation system in Australia. A portion of your earnings goes into a savings fund that is tax-advantaged and managed by a designated Superannuation provider. Industry funds manage 40% of Super assets, SMSF’s 28%, Retail funds 23%, and Public Sector funds 8%(2025 data).
The nub of the Superannuation contract is that you usually can’t access these funds till retirement age. Total Superannuation funds in Australia are a staggering $4.4 trillion (at the end of the March 2026 quarter) which makes it the 4th largest retirement savings system in the world.
Although Slack Investor would argue that Super fees are still way too high. It turns out that these providers are generally good at managing your money – and letting compound interest grow your savings. The median yearly performance for Growth-type Super funds (61%–80% of fund allocated to growth assets) is shown below. With the exception of the last few years before retirement, your Super should be exposed to growth assets and letting the compounding of earnings to do its work.
A success story for Median performance of Super ‘Growth Funds’ since 1993. Chant West
Slack Investor takes delight in the dominant sea of blue in these median returns for Super growth funds – but notes the word of caution from Chant West that these are extraordinary times for yearly performance.
The long-term return objective for growth funds is to beat inflation by 3.5% p.a., which translates to roughly 6% p.a. Four consecutive years above 9% is an outcome to be pleased about, not an expectation to set.– Chant West
One year results are well and good but Slack Investor is more genuinely impressed with long-term performance. Shown below are annualised returns over 10 years. If you have your Super with one of these providers – you have been doing pretty well.
Returns are shown net of investment fees and tax (but before administration fees). Chant West defines Growth funds as those with 61%–80% allocated to growth assets. Chant West (LiveWire)
Vanguard Financial Year 2026 Total Returns for major asset classes
Extract from the FY 2026 Vanguard Index Chart Brochure showing the total returns for each asset class for the financial years since 1996. Top performing asset class for the year is highlighted in blue/green and the worst in pink/orange.
Vanguard Annual Chart 2026
This is Slack Investor’s favourite chart – a succinct demonstration of the benefits of long-term investing. The essence of successful investing is to be invested at leastsomewhere in appreciating assets – and then, let time do its work. Below is an extract from the Vanguard 2026 long-term investing chart. The numbers on the right are the results of investing $10,000 in the Index funds of the indicated asset classes for 30 years.
Extract from the 2026 Vanguard Index chart (Just the 2005-2026 portion is shown) – the dollar values on the right are the results of investing $10,000 in index funds in each asset class for 30 years (since July 1996). – Check out the full 30-year glory of the Vanguard 2026.PDF chart – Click image for the whole 30-yr chart.
August 2026 – End of Month Update
Slack Investor is IN for Australian index shares, the US Index S&P 500 and the FTSE 100.
The S&P 500 (+3.0%) continues its progress. Slack Investor is pleased to go with the flow but remains nervous for the US markets. Some more moderate movement for the ASX 200 (+1.1%) and the FTSE 100 (-0.4%).
All Index pages and charts have been updated to reflect the monthly changes – (ASX Index, UK Index, US Index).
‘You can’t know where you’re going until you know where you’ve been.‘
(Anonymous)
Slack Investor likes to put things in spreadsheets, especially long-term results. In the world markets, for FY 2026, the top performers were the UK FTSE 100 Total Return Index (up 22.8%; FY 2025 up 10.8%) and the US S&P 500 Total Return Index (up 19.6%; FY 2025 up 15.2%). Dividends helped the Australian Accumulation Index struggle to be up 5.8%; FY 2025 up 9.0%). All of these Total Return Indices include any accumulated dividends.
Many mistakes were made this year on stock selection. However, Slack Investor has stuck to his strategy of mostly investing with growing companies that are profitable (Return on Equity >15%), have an established earnings record and, not too expensive (forward P/E ratios <50). He expects a bit of volatility in his growth oriented investment portfolio. He is reassured that, despite the odd negative year in the Slack Fund, the dividends and his separate Stable Income portfolio are doing what they should – keeping Slack Investor with enough cash to ‘keep the wheels on’ the Slack lifestyle – when the investment portfolio sours.
Slack Portfolio Results FY 2026
All Performance results are before tax. The Slack Portfolio is Slack Investor’s investment portfolio. He is saddened to report an annual FY 2026 performance of -1.3%. Full yearly results with Australian benchmarks are shown in the table below. Although disappointed with this years results, Slack Investor realises that only long-term results really count.
Of course, the real estate industry avoids true measurement of real estate performance by collecting figures only on gross price changes – they ignore the significant transfer costs involved (Stamp Duty, Conveyancing, Bank Fees, etc) and, the hidden costs of any home improvements and renovations. For property values, Slack Investor is using these gross figures supplied by realestate.com.au for Brisbane and Melbourne homes. Slack Investor realizes that these gross figures give inflated performance results for real estate when compared with other benchmarks – which, because of their much lower transaction costs, measure more closely the net performance.
The FY 2026 Cash Rate of 3.7% is below CPI measured inflation (3.8%). Inflation is above the Reserve Bank target range of between 2% and 3%. Cash is important – but not a way to grow your wealth. Since 2010, from the table below, the average readily available cash rate of return is 2.7% and, for CPI measured inflation, it is 2.8%. In Investment terms, you are going backwards with cash.
Although Slack Investor collects yearly figures, the 5 and 10-year compound annual performance gives him a much better idea about how things are really going. Long-term results will smooth out any dud (or remarkable!) yearly figures. Over 5 years, the Slack Fund is ‘neck and neck’ with the inflated performance of Brisbane Residential real estate – but comfortably ahead of all other benchmarks.
The Slack Fund average 5-yr compound yearly return vs BENCHMARKS in chart form.
10-year compound annual rate of return
The Slack Fund has been around a while and generating some good long term data (10-yearcompound ‘rolling’ annual rate of return). Over this time frame, the Slack Fund has been performing very well. For FY 2026, a 10-year annual rate of return of 15.7% – Go Slack Fund! The 10-yr data is shown below in table and chart form.
It is useful to note that, over the 10-yr time period, rates of return for the Median Balanced Fund, Vanguard Growth fund, ASX200, and residential property in Brisbane have been good long-term investments. These appreciating assets generate a 10-yr compound annual rate of return in the region of 6-9% p.a. Melbourne real estate, with a 2026 average 10-yr compound yearly (inflated!) return of 3.9% has turned out to be a relatively poor investment.
The Slack Fund average 10-yr compound yearly return vs BENCHMARKS in table form. Prior to 2022, 10-yr Vanguard Growth fund figures were not available. AV. 10-YEARLY (ALL) is the annual mean of all the 10-yr data since 2019.
Although Cash is necessary to add stability and flexibility to a portfolio. From the chart below, Cash as a long-term investment vehicle, is a poor choice.
The Slack Fund average 10-yr compound yearly return vs BENCHMARKS in chart form.
15-year compound annual rate of return
Perhaps because Slack Investor is showing signs of age, he notices that there is enough accumulated data for rolling 15-yr rates of return. Happy to report solid long-term results.
The Slack Fund average 15-yr compound yearly return vs BENCHMARKS in table form. AV. 15-YEARLY (ALL) is the annual mean of all the 15-yr data since 2025.
Growth of a $10 000 Investment Since 2009
The beauty of compounding with a succession of good performance results can be seen in the chart below showing the growth of an initial investment in June 2009 of $10 000.
Despite a relatively poor 2026, when considering long-term results, the Slack Fund has exceeded all expectations. Also, the chart shows that investing in either shares or residential property has been a solid way of growing your money over the long term.
‘We must accept finite disappointment, but we must never lose infinite hope.’
Martin Luther King
Slack Investor experienced plenty of disappointment this financial year. On reflection, most of it was self induced. He was dazzled by some of the growth projections that he found on Market Screener– and forgetting that these are just analyst forecasts – and sometimes not achieved. As a result, he got involved with too many early stage companies that experienced regulatory failures – or just fell short of expectations. This year, there was also the AI scare that put the shivers up owners of software and healthcare stocks. These sectors could be vulnerable to cheaper AI interventions that might affect future incomes.
This post is just one part of the annual review of the Slack Portfolio. The percentage yearly returns quoted in this post include costs (brokerage) and dividends but, the returns are before tax. These raw figures can then be compared with other investment returns.
Slack Investor uses the incredibly useful Market Screener to analyze the financial data from each company. This excellent site allows free access (up to a daily limit) to analysts’ data. Once you register with an email address on their site, you can use the financials tab to get information for each stock.
Slack Investor uses forward-looking numbers – so, sometimes, things can go wrong. He extracted the predicted 2028 Price/Earnings (PE) Ratio and Return on Equity (ROE) and average forecast revenue growth for the financial years 2027 and 2028. He usually requires that the forecast Earnings Per Share (EPS ) growth will be greater than 15%. He then condenses all this information into one number, the Slack Ratio. This is the ratio of forecast ROE/forecast PE.
The Slack Ratio, is a way to make things easy for Slack Investor’s limited brain. This ratio is still ‘experimental’ and used to differentiate between stocks. The higher Slack Ratio, the better. Slack Investor generallylikes the Slack Ratio to be above 0.7.
Slack Investor Stinkers – FY 2026
Financial year 2026 was again big on volatilty. Slack Investor knows that stinkers are a part of the game, even in good years. Unfortunately, he managed to attach himself to a multitude of stinkers this year. Slack Investor managed to be in some unfashionable sectors – and, in hindsight, also made some bad individual company selections. Again, this is just part of the game.
Botanix Pharma (BOT) -60%
(BOT – Forecast 2028: PE 3, ROE 28%, Av. Growth 30+%, Slack Ratio 9.3). Slack Investor entered the murky and volatile world of Biotechs with a small stake (0.2% of portfolio) in this Australia-based dermatology company. Their topical gel (Sofdra) is used to treat excessive underarm sweat. This has to be Slack Investor’s weirdest purchase – and he was sold on the ‘sizzle’, not the steak. The company is ‘expected’ to be profitable in 2028. However, the market has some doubts about this. Slack Investor bought on the good numbers (above) at $0.35, sold in November 2025 at $0.14. Latest price $0.02– A humiliation!–and a lesson in getting involved with speculative stocks.
CSL (CSL) -50%
(CSL – Forecast 2028: PE 12, ROE 18%, Av. Growth 30+%, Slack Ratio 1.5). CSL is a big holding for Slack Investor (6.3 % of portfolio). CSL was a Stinker in FY 2025, but they have continued to spend on Research & Product Development at levels around 10% of revenue. This should be a good thing for future earnings. However, a series of earnings downgrades and management changes have tested market confidence in the company. Slack Investor realizes that CSL is not the growth machine that it once was – but it still is one of the world’s leading biotechnology companies. At this stage, he is sticking with CSL and is buoyed by some recent price rises –but he feels that his loyalty has not been rewarded and would have no problems in selling his stake if a better opportunity presented.
REA Group (REA) -41%
(REA – Forecast 2028: PE 24, ROE 33%, Av. Growth 15+%, Slack Ratio 1.3). This real estate powerhouse has been part of the Slack Portfolio for a long time and it too might be losing its mojo as a growth superstar. Property is cyclic in nature and this FY there has been a softening in property listings and therefore revenue. The market quickly bailed out. Slack Investor has the long view on this one. Future numbers (above) still look reasonable and he is prepared to ride this one out.
Telix Pharmaceutical (TLX) -38%
(TLX – Forecast 2028: PE 32, ROE 9%, Av. Growth 30+%, Slack Factor 0.3). This company develops and markets radio-pharmaceutical products that are used to treat cancers in a precise fashion. TLX is less than 1% of the Slack portfolio and is his most speculative stock as the company is not predicted to be profitable till 2027. FY 2026 has been tough on Telix with some regulatory hurdles and some other trouble with US authorities. These problems seem to be mosly overcome and the share price has risen – but there is still some risk. The ROE is low, but the projected growth is over 100%. If the positive momentum continues, Slack Investor will add to his position.
Cochlear (COH) -35%
(COH – Forecast 2028: PE 20, ROE 18%, Av. Growth 25%, Slack Ratio 0.9). COH is a great Australian company but it has had a shocker of a year with a series of earnings downgrades. In a counter-cyclic move, Slack Investor bought 5 months ago at about $190 after the first downgrade announcement. Mistake! These downgrades seem to usually occur in bunches. At the current price of $120, it seems good value. Will stick with this one and try to learn from this error.
Wisetech Global (WTC) -34%
(WTC – Forecast 2028: PE 18, ROE 17%, Av. Growth 30+%, Slack Ratio 0.9). WTC has great logistics software that is the industry standard. The underlying business is solid and was unfairly dumped during the AI scare. However, the real problems have been with the scandals associated with the founder and executive chairman Richard White. Mr White has recently resigned and this has triggered a share price recovery. The recovery is going well and Slack Investor is considering adding to his share parcel in WTC.
Slack Investor also went backwards with many of his other holdings. Car Group (CAR) -29%; Technology One (TNE) -27%, though it was a nugget last FY +124%; Plenti Group (PLT) -24% – What was Slack Investor thinking?
Slack Investor Nuggets – FY 2026
Nuggets are a blessing in any portfolio. Fortunately, this Financial Year, there were some bewdies! Slack Investor continues to invest in high Return on Equity (ROE) companies with a track record of increasing earnings. If expectations are met, companies with these qualities sometimes behave as ‘golden nuggets’.
Codan (CDA) +122%
(CDA – Forecast 2028: PE 32, ROE 28%, Av. Growth 15%, Slack Ratio 0.9). Codan is a technology company that specializes in communications and metal detecting. What a great company – also a nugget in FY 2025(+75%)! It is one of Slack Investor’s core holdings. CDA has had a checkered past – a nugget in FY 2021 (+161%), a stinker in FY 2022 (-58%), a nugget in 2024 (+54%), and again a nugget (+75%) in 2025. What has kept me in the stock was its low debt, (generally) increasing earnings, and the high profitability (ROE 28%).
SKS Technologies (SKS) +73%
(SKS – Forecast 2028: PE 15, ROE 63%, Av. Growth 30+%, Slack Ratio 4.2). A recent purchase, SKS is an electrical and networking service company that delivers ‘advanced technology solutions’. It has recently landed big contracts for data centres and has a further upstream tender pipeline of $1.25B AUD. These ‘contract for income’ companies need constant surveillance but Slack Investor was at a Wilson Asset Management seminar this year and a speaker impressed him with his ‘Picks and Shovels’ approach to investing in the new wave of AI and Large Language Models (LLM’s) … and he did, and would like to buy more!
RPM Global Holdings (RPM) +71%
(RPM – Forecast 2027: PE 154, ROE 53%, Av. Growth 38%, Slack Factor 13). RPM is a mining services provider that had a happy association with Slack Investor. There was a takeover early this year by the NYSE-listed big company – Caterpillar. Slack Investor had to bow out – but with money in his pocket!
Alphabet (GOOGL:NASDAQ) +36%
(GOOGL– Forecast 2028: PE 20, ROE 22%, Av. Growth 25%, Slack Ratio 1.1). What a powerhouse. Alphabet continues to have high profitability (ROE 22%). There are some concerns over reduced earnings in 2027, AI spend, and competition – but his everywhere company keeps surging ahead. Happy Owner.
Vanguard Asia (Ex-Japan) ETF (VAE) +30%
(VAE – Market Screener Data unavailable. VAE is one of Slack Investor’s core holdings – providing exposure to Asian Markets. After a lacklustre few years, it has finally started to provide the growth from Asia that Slack Investor envisaged. A Long-term hold.
Some honourable mentions to some top results this year that didn’t quite make the nuggets. Megaport (MP1)+27% and Coles (COL)+19%. COL is now, not in the Slack Portfolio, but in his Stable Income portfolio.
July 2026 – end of Month Update
The new financial year has started off positively for the Australian and UK markets. The ASX 200 +2.3%; FTSE 100 +3.5%. The S&P 500 is taking a well-earned breather and has had a flat month (-0.1%). He remains IN for all index positions.
All Index pages (ASX Index, UK Index, US Index) and charts have been updated to reflect the monthly changes.
Slack Greetings from Cambridge, UK – A busy day punting on the River Cam.
Slack investor generally likes to avoid making predictions. He is just stumbling on in this investing world, using a bit of financial discipline to try and make more good calls than bad. The whole point of this blog is to highlight that you only need to be ‘mostly right’ to be a successful investor.
It has been a couple of years since Slack Investor has had a look in the ‘room of mirrors’ – at some of the things said in this blog. A bit of reflection is good for the soul. Some of my buys and sells will be mentioned in next month’s ‘Nuggets and Stinkers’, but there have been a couple of issues nagging at my small brain. This is the type of report card that you may have difficulty to show to your parents.
Three years ago (2023), Slack Investor was flattered when his nephew asked him for some advice on starting a stock portfolio. Converting hard earned cash from part-time jobs into the risky area of the stock market takes some admirable gumption – his nephew was 14 at the time. Slack Investor found some suitable ‘safe’ stocks (he thought!) in his own portfolio. He deliberately avoided the more speculative part of the stock world – as he wanted his nephew to have a good experience owning stocks. Shown below, is the basket of stocks that Slack Investor recommended. A collection of well known, growing companies that were not outrageously over priced.
The first review of this portfolio was at the end of FY 2024 and Slack Investor was secretly pleased that the average 1-yr growth of the portfolio was 30.9%. He prematurely gave himself 9/10. Things have changed in the two years after that initial review. Let’s just say that things didn’t go as expected (CSL down 37.7% – Ouch!). Overall, the portfolio fell 2.8% in the subsequent two years..
The basket of stocks that Slack Investor thought would be suitable for a young person starting out in the world of investing in 2023. The Compound Annual Growth Rate (CAGR) is shown for the 1st year, the next two years, and for the whole 3 year period so far.
Another lesson in hubris for Slack Investor. These figures do not include dividends. In hindsight, Slack Investor would have been better off recommending more diverse products such as ETF’s for the ASX 200, S&P 500 or the NASDAQ 100. However, Slack Investor thinks that you learn a lot more about the stock market when you are invested at the company level.
Over 3 years, the overall Compound Annual Growth Rate (CAGR) for this recommended portfolio was a lackluster 6.2%. Slack Investor hopes that his nephew is not too disheartened and will keep an interest in shares. All of these companies may not be the growth machines that they used to be – but they are still solid businesses. There are already a few signs of a comeback in the punished shares (CSL, CAR, REA).
There is a lesson here. Sometimes things don’t go as planned in the share market. Be prepared to change strategy if your shares are really on the stink. The share market can be cruel. Be diversified and take a long term view.
A very average effort Slack Investor – 3/10; Nephew – ?/10 (Definitely disappointed in his Uncle – but hang in there!).
Slack Investor was talking about things that he admires and looking at futere ways to handle his bucket of investments when he doesn’t want to manage it himself. He started spraying on about the Hyperion Global Growth Companies Fund ETF (ASX: HYGG). HYGG has the most excellent long term performance record over 5 and 10-yr periods. They have consistently beaten benchmarks with annual returns averaging over 15%.
Since posting, HYGG performance for FY 2026 is a not so good -2.5%. Again, only long term performance counts. Sometimes good investors just go through lean periods. Slack Investor has faith in the HYGG team, and himself. Good companies generally do well over the long term.
Slack Investoris easily led by long term performance. Must stop talking in class; 5/10.
Financial Year 2026
A quick review of how the Slack followed markets fared in FY 2026. The Total Return amounts shown for the financial year (1 July 2025 – 1 July 2026) are from Investing.com and they include dividends. Slack Investor has noted that these Total Net Return amounts sometimes get updated and the figures below are just approximations.
ASX 200
ASX 200 Weekly chart for FY 2026 (Click to Enlarge) – From Incredible Charts
After a solid 2025, FY 2026 could be described as a financial year that is really not going anywhere for the ASX 200 – the ASX 200 Net Total Return ended up 3.8%.
FTSE 100
FTSE 100 Weekly chart for FY 2026 (Click to Enlarge) – From Incredible Charts
Things were more robust for the UK Index. When accumulated dividends are re-invested, the FTSE 100 Total Return was up 18.5%.
S&P 500
S&P 500 Weekly chart for FY 2026 (Click to Enlarge) – From Incredible Charts
The mighty US of A, has done it again. When accumulated dividends are re-invested, the S&P 500 Total Return was up an amazing 20.9%.
The Slack Portfolio 2026 – Preliminary results
Lean times for Slack Investor this financial year. His portfolio includes many healthcare and Software as a Service (SaaS) stocks, that were recently beaten up. Investors were worried about the effects of AI on future revenues.
Slack Investor preliminary FY 2026 results – a negative 1.0 %. At some stages this year, my account was almost 10% out the back door.
One of the pleasures of retirement is the joy of travel and Slack Investor is about to head off to Brittany and the UK. He is fortunate that Ms Slack Investor has many skills in the travel booking department – and he doesn’t have to worry about accommodation, flights, or train and ferry tickets. However, there are some responsibilities that have landed on Slack Investor’s desk. Any products mentioned are not sponsored – but just things that he likes to use.
Insurance
Fortunately, Slack Investor has a Commonwealth Bank Ultimate Rewards credit card that offers free overseas travel insurance. This Cover-More policy requires a card spend of $500 on travel and has an excess of $500. Important Note: If you think you would like a credit card for retirement – get yourself sorted out while you are still working. Getting the card that you want is increasingly difficult when you are retired – and only relying on superannuation income.
Travel Money
The Commonwealth Bank Ultimate Rewards credit card has no international transaction fees and uses the Mastercard default rate in working out foreign exchange rates. So, he will use this card for most swipe transactions. His money cards are also loaded into his phone wallet.
For cash, he avoids the horrendous cash advance fees on credit cards by using his Macquarie Bank Debit Card. This exceptional card offers no international transaction fees and uses the Mastercard FX swap rate. Some overseas ATM’s will have a usage fee. However, by using only major banks in overseas countries, Slack Investor has mostly avoided these.
Slack Investor has much praise for his Macquarie Bank Transaction account. This account is the best that Slack investor has ever had. Features include:
No Macquarie fees when using overseas.
No Fees and 2.75% interest on your domestic transaction account.
Great app and transaction control.
Linked Savings account offers 5.0% interest.
Phones and Sims
One day there will be a time when you can just have just one sim in your phone and you can roam the world using that sim at a reasonable cost. It is not this day as yet. Currently, the best option is to get another sim for overseas travel. This can cause some complications with two factor authentication if finance institutions wanting to SMS your Australian sim. In most cases, you can work around this by communicating through the finance app. As a last resort, just swap back the Australian sim temporarily for any vital sms communication.
For older phones that can only use a physical sim, it is cheapest to pick up a local sim at the airport, or a convenience store, when you arrive. If you don’t want this hassle and have time for the Australian company TravelKon to post you a sim from Perth – they have 30 day 20GB physical Europe sims for $28.
If your phone can handle an e-sim, this is the best way to go. Slack Investor found the best deals for multiple country Europe/UK were through E-tel Mobile and TravelKon.
The cheapest e-sim options were for a data only plan – and any required phone calls can be made through a VOIP application like WhatsApp. Slack Investor would use Wi-Fi at his accommodation for any big data requirements. For maps and searches during the day, 10GB for 30 days would be plenty. E-tel has a 30 day 10GB Europe plan for $27.90 AUD. TravelKon have a sale on at the moment – a 30 day 10GB Europe plan for $20.30 AUD. These e-sims can be set up before leaving Australia – and will automatically activate on arrival in Europe.
Finding my phone
Slack Investor should be more vigilant … and will try to be better. However, he has a Samsung Android phone and is prone to leaving it on tables etc. He often finds his phone using his google account. Just put ‘find my phone’ in any browser to locate the google find hub. You can ring your phone or find it on a map or lock it from this site once you have signed in to this site.
It occurred to me that this would not be as easy in a far off land. For an extra layer of security, both Ms Slack Investor and myself have shared locations with the Samsung Find app. If either of us leaves our phones somewhere, we should be able to locate it.
For those in iPhone world, I am sure there are similar Apps. A company that Slack Investor recently bought, Life360, has a family location app with a free tier.
Other Travel Considerations
Slack Investor likes to travel light and tries to do a lot of walking on his breaks. His Osprey Farpoint 40-litre Travel Pack combined with packing cubes for internal organization has proved to be a reliable companion. The pack is sized for cabin baggage and can be found for $284.29 AUD. Ms Slack Investor uses the similar 38-litre Kathmandu Litehaul (on special at the moment for $179.98). Depending on the airline cabin bag policy, the weight varies between 7 and 10Kg.
A special mention to my compact travel power adapter available e-bay Australia for $20.98 AUD and my portable clothesline (available under $10). For the lightweight traveller, hand washing is crucial and a clothes line is essential. So is 4m of extra cord to help tie up the line in tricky layouts. For emergencies, a hotel hair dryer is a handy sock drying tool.
June 2026 – End of Month Update
The end of another Financial Year. Slack investor will summarize the year in the next post. The S&P 500 (-0.3%) and the FTSE 100 (+0.1%) took a well-earned ‘breather’. The ASX 200 returned a solid 1.5% for the month.
Slack Investor remains IN for all markets.
All Index pages and charts have been updated to reflect the monthly changes – (ASX Index, UK Index, US Index).
The quarterly updates showing the current holdings and cash position of the Slack Portfolio have also been completed.
Poolside at the Elandra Resort, Mission Beach, Far North Queensland (FNQ)
Slack Investor has just returned from a holiday in beautiful Far North Queensland. A stay at Mission Beach reminded him of a venture proposed by Mayfair 101 – 7 years ago. The founder, James Mawhinney came to Mission Beach in 2019 with a vision of developing the recently tropical-cyclone-ravaged area into a major tourism destination. The plan included the purchase of Dunk Island, the Elandra Resort and 230 other properties in the Mission Beach area. This, naturally, caused a lot of local excitement. However, any tourist development in a cyclone-prone area (two hours from an international airport) is, at best, a speculative investment. Slack Investor was not impressed with the offering and presented a ‘run for the hills’ argument.
Mayfair … You’re ‘investor-facing division’ is not getting any of Slack Investor’s money. Despite the slick presentations and corporate glitz – Slack Investor, November 2019
The problem was that Mr Mawhinney planned to pay for this development with investors’ cash – those who bought into his Mayfair 101 funds. Further, he portrayed these funds as ‘A popular cash and term deposit alternative…’ ASIC determined that these claims were ‘misleading and deceptive’.
Following an ASIC investigation, James Mawhinney, of Port Melbourne, Victoria, has been arrested and charged with four counts of engaging in dishonest conduct in the course of carrying on a financial services business. – ASIC Media Release, 9th April 2024
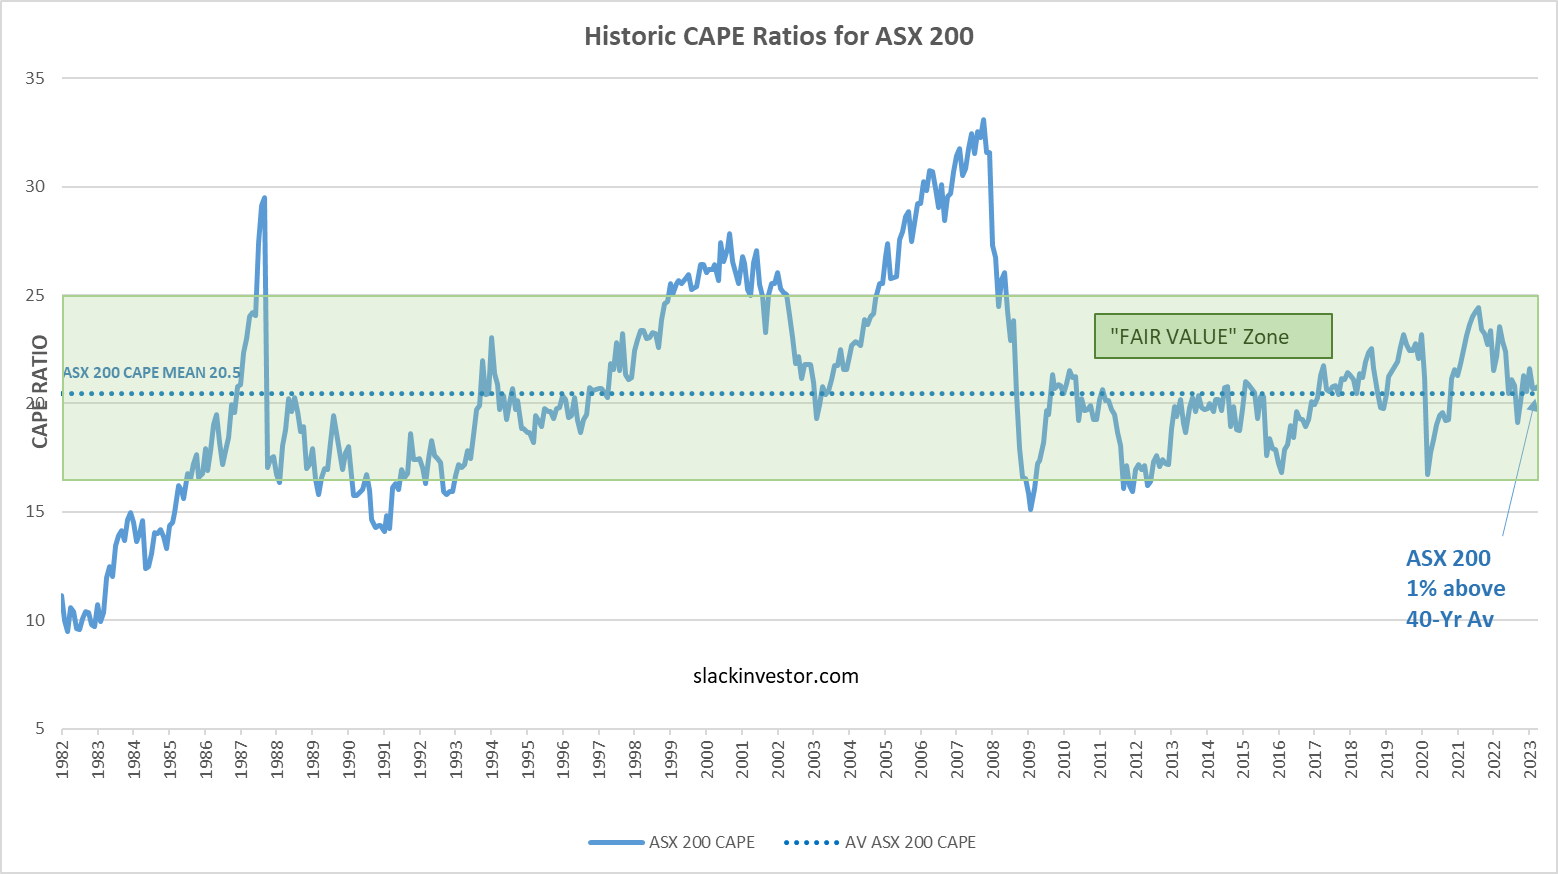
Slack Investor likes to keep up to date with how the markets are travelling for value and he has been using charts for the Cyclically Adjusted Price to Earnings ratios (CAPE). This value is also known as the Shiller P/E Ratio after Robert Shiller the economics professor that made this measure popular. Slack Investor first started using CAPE as a ‘value’ tool in September 2021. The most recent post on Market Value was November 2025 – about 7 months ago.
For the following charts, Slack Investor uses monthly CAPE data from Barclays, the 40-yr mean is calculated and plotted together with the latest actual CAPE values up until 29 May 2026. A ‘fair value’ zone is created in green where the CAPE is within one standard deviation of the mean (average) – click images for better resolution.
ASX 200 CAPE Value 22.38 (9% above long-term av.)
ASX CAPE values – up to 29 May 2026
FTSE 100 CAPE Value 18.99 (9% above long-term av.)
UK CAPE values – up to 29 May 2026
S&P 500 CAPE Value 40.19 (60% above long-term av.)
US CAPE values – up to 29 May 2026
The UK and Australian markets are not too overvalued. However, in terms of the Shiller P/E the S&P 500 has remained in overvalued territory. Unfortunately, whenever the S&P 500 has a large correction the effects are usually felt in other markets.
There is some good research that links CAPE to long-term returns … and future returns are what gets Slack Investor excited. The predictive skill of the Schiller CAPE is not very good over 1-yr and 5-yr periods. However, it does show some skill for periods of 10 years and longer. The tight spread around the trend line indicates that the Shiller P/E might have some predictive skill.
Shiller P/E and S&P 500 10-year annualised forward returns since 1983. The data shows 41 years of S&P 500 10-year average annual returns based upon the Shiller PE ratio (from 10 years ago). Slack Investor has modified the chart and circled the 10-year average returns based upon the times when the Shiller P/E was previously around 40 – From Invesco.com
If this relationship holds, the average S&P 500 10-year annualised forward returns are predicted to be close to zero or negative. This indicates that now is not a good time to start buying the S&P 500.
The Buffet Indicator as Value
The Buffet Indicator (Green) is the ratio of the total United States stock market to GDP. The line in Blue represents the ratio that also includes total Federal assets. The red line is the 20-yr average of the Buffet Indicator – from GuruFocus
Another way of determining market value is the Buffet Indicator. Mr Buffet regards this as ‘probably the best single measure of where valuations stand at any given moment.’ It uses the historical ratio of big economic values The Total US Market Capitalization (TMC) over US Gross Domestic Product (GDP). The 20-yr average of this ratio is 128.84%. The current ratio is now 233.8 % of the latest GDP. Based upon these figures, Buffet Indicator implies the US Market is ‘Significantly Overvalued’ and it is likely to return -1.2% a year from this level of valuation, including dividends for the next 8 years.
Grim News. The recent ‘frothy’ SpaceX Initial Public Offering breaking all sorts of records – for a currently loss-making company – is another symptom. With the exception of Platinum 101, Slack Investor is not a great predictor of events, but ‘in his waters’ he thinks we may be near the top of the market.
Slack Investor is a big fan of the colourful short for aquatic activities and, as a result, Ms Slack Investor is glad that winter is approaching. However, he is not generally a fan of investing in a shorted stock. He has learned this lesson the hard way – on a few prevous occasions.
Short selling is a technique used to profit from a fall in the price of a stock. It is a method where you sell first, and buy later – if the price of the stock drops then you are selling for a higher price than you are buying resulting in a profit. – Shortman
A company might be on the short selling list because there may be doubts about the underlying business. Or, more commonly, the business is OK but the share price has outpaced earnings – the price has gone up well ahead of earnings and the current Price/Earnings (PE) ratio is way too high.
Luckily, there are websites that track this short selling activity on the ASX. Shortman is one of the most comprehensive. Slack Investor did have a dabble into the short market in his early investment life but he thought it wasn’t a natural fit for his game – as he is an eternal optimist.
When a stock has a high short interest, it means a meaningful portion of the available float has been borrowed and sold by traders betting the share price will fall. In simple terms, it is the market’s aggregate bearish view expressed with real money on the line. – StocksDownUnder
Most of the time, it is a good idea to avoid stocks that are heavily shorted – where a good percentage of the market thinks these stocks are going down in price. It usually doesn’t make much sense to swim against the current. Ideally, what you really want, is to own a company where others in the market also want to invest. This sets up a scenario where the stock price rises.
Top Shorted Stocks
At the 26th May 2026, the top 15 shorted stocks on the ASX by aggregate percentage with their weekly change in shorting interest. The short list data is prepared by the ASX and has a 5-day delay – shortman.com.au
Slack Investor has a small position in Telix Pharmaceuticals (TLX) (~1% of investment portfolio). Alarmingly, 14.83% of the stock on issue is owned by short sellers. He neglected to look the stock up on Shortman prior to purchase. This could be a mistake!
Therefore, this play carries quite a bit of risk. Slack Investor was carried away with the power of the ‘Wedgie’. The short sellers are betting that future revenue predictions where Market Screener shows the PE declining from its current astronomical value of 750 in 2026 to a manageble 33 in 2028 – will not happen!
On the plus side, TLX on track to meet 2026 revenue forecasts and the shorts have started to decline (weekly change down 0.28%). At this stage, he is optimistic that the tide may turn. But, if the price drops sharply at one of the weekend reviews, Slack Investor will have to bail and hand another victory to those pesky ‘shorters’.
May 2026 – (Early) End of Month Update
Slack Investor has gone early for this post as he is off to his old ‘stomping ground’, Far North Queensland, for a few weeks. He will be taking his colourful shorts and remains IN for Australian index shares, the US Index S&P 500 and the FTSE 100.
The ASX 200 (-0.2%) was flat so far this month. The FTSE 100 (+1.1%) and the S&P 500 (+4.3%) have had a positive month so far. The US Index (S&P 500) has been so bouyant that it needed its stop loss moved upwards. Prices were 15% above the previous value. The new US stop loss was difficult to find and Slack investor had to go to the daily charts to find a sensible low point to put the stop loss. He moved it up to the new ‘higher low’ of 7046.
All Index pages and charts have been updated to reflect the monthly changes – (ASX Index, UK Index, US Index).
The top of the wedge downtrend line should be drawn for a period of at least 3 months (preferably 6 months) and connect at least 2 (and preferably 3) descending high points.– Slack Investor
Weekly price charts for REA Group (REA), Megaport (MP1), IPH Ltd (IPH), Goodman Group (GMG), Car Group (CAR) and the ASX listed Greyscale Bitcoin Trust ETF (GBTC). The price bars are emerging from the wedge-shaped downtrend.
Slack Investor will report back in a year’s time to see how these stocks fared. He included (above) the ASX listed Greyscale Bitcoin Trust ETF (GBTC) – not because he is an investor … but, just for sport.
CSL Dumpster Fire
It brings no joy to Slack Investor to discuss his own failings. But, it is part of investing and all investors will have a similar story. Emotion comes into this as CSL was one of the first things that I invested in – way back in 2010 when it was around $30! He has bought more shares along the way. The most recent purchase was at $282 (Ouch!). CSL was his first ’10-bagger’ and it gained a special place in his heart when it reached the dizzying heights of over $300. It is now under $100.
CSL has delivered a succession of earnings misses and guidance downgrades that, one by one, have stripped away the premium investors assigned to the ASX’s most trusted name. – Carl Capolinga, Livewire
Slack Investor has always taken a look at CSL after each of the 3 earnings downgrades and price slumps since 2025. He does this by going to the financial page of CSL on Market Index. Each time, he has convinced himself by looking at the analysts earnings growth projections that a recovery is imminent, and he has not sold. Sadly, the bad news of earnings not meeting forecasts has continued for 18 months.
In investing, the investment decision may be right … but the timing wrong. Or, sometimes bad things just happen. The best investors seem to be able to sense this – and are more ruthless in getting out of a stock than Slack Investor.
He was not alone in thinking the CSL price would recover. The table below shows Broker analyst predicted consensus rating and targets after each reporting season downgrade. The consensus was a BUY rating after each price slump. Ahh well … Slack Investor has only modest aims – mostly right over the long-term.
In hindsight, Slack Investor would have been much better off selling after the first (or second, or third) earnings downgrade and waiting for the ‘Wedgie’ recovery. However, Slack Investor is a complex mix of attributes and foibles … sometimes the foibles win! He still holds his CSL shares.
In his youth, it was a revelation to Slack Investor that some people didn’t have a job – they just had income derived from assets.
He didn’t know of anyone who was independently wealthy, and thought that the normal course was to work hard till retirement age, then apply for the government pension. That’s what his parents and grandparents did. Those who have been employed since compulsory super emerged in the 1990’s can rely on industry-based super plus any extra savings.
Slack Investor has had the aim of being independently wealthy – being able to support retirement through income from assets (investments). This is the goal. However, things happen along the way, and the next best thing would be to own your own (even modest) home before retirement and get to the ‘sweetspot’ of assets. As of March 2026, this is where a couple can have between $470 000 and $1 045 500 in retirement assets and still qualify for some government-funded aged pension to top up their income from savings.
The Path to Independent Wealth
It was reading the pioneer finance blogs of people like Mr Money Moustache that the idea of ‘Independent Wealth’ could be pursued by a normal working person. First, you have to save your retirement funds. Hopefully, the fund return will be a few percent above inflation and then you can withdraw money (based loosely on the ‘4% rule’) to live on.
The Independent Wealth Path Could be Tricky in the Next Decade
Due to the current high valuations, Vanguard is predicting a lower than average median 10-yr return for equities for the next 10 years. The Vanguard predictions are based upon past data and do not account for the productivity benefits of AI – which might justify current valuations – but they are a concern.
Slack Investor’s view is that no one really can predict the future, and there is a high volatility expressed with these equity forecasts. However, the Vanguard model 10-yr forecasts have usually been correct between the 25th and 75th percentile ranges. This gives a more rubbery forecast that Slack Investor is happier to work with. From the Vanguard Capital Markets Model forecasts issued April 2026, the predicted 10-yr percentile annual returns for each asset group are shown below. Median predictions for 10-yr earnings in stocks are the lowest since this prediction model was developed. When compared to historical returns over the past 30 years (Vanguard), the median forecasts are quite low for stock-related investments.
Asset Class
25th Percentile Forecast
Median Forecast
75th Percentile Forecast
Vanguard Historical 30-yr av. Returns
US Equities
2.6%
5.9%
9.6%
10.1%
Global (ex US) Equities
3.1%
6.0%
9.1%
9.6%
Emerging Markets
0.5%
4.6%
8.7%
9.9%
US Treasury bonds
4.0%
4.6%
5.3%
4.1%
US Inflation
1.4%
2.0%
2.5%
2.6%
Vanguard model predicted 10-yr (From 2026) percentile and median annual returns for each asset group. The historical average for the previous 30-yr is also shown.
The ‘Independent Wealth’ path could be tricky to negotiate in the next 10 years if the forecast 10-yr returns are nearer the 25th percentile – there is a 25% chance that the returns will be lower than this. The best way to protect your funds is to hold a good portion of them in stable reserve. Slack Investor has about 30% of his funds in annuities, cash/bonds, stable dividend stocks, REIT’s, etc. Also, keep your retirement portfolio diversified across asset classes.
What Slack Investor did with the ‘4% Rule’
Before retirement: He used the ‘4% rule’ of thumb to determine the equivalence of salary and income, so that he knew if he had enough funds to retire.
For example, if a retirement salary of $40 000 for a couple is required, the 4% rule indicates that we should multiply this amount by 25 to get our retirement lump sum.
$40 000 x 25 = $1 000 000 in retirement funds
$80 000 x 25 = $2 000 000 in retirement funds, etc
First 5 years of retirement: Be careful here, this is where you are most prone to sequencing risk.
Sequencing risk (also called sequence of returns risk) is the danger that a significant market downturn in the early years of retirement will permanently damage your portfolio – Wealthlab
Slack Investor encountered below average returns in his 2nd and 4th year of retirement. He coped with this in two ways.
1. A dynamic spending strategy approach to net withdrawals from the retirement fund. After a good year, we would spend more on holidays. A bad year would mean a more modest approach.
2. The use of pile theory (buckets). His initial spread was 70% in investments and 30% in stable income. He has tried to keep these ratios reasonably steady by withdrawing from the over allocated pile each year.
Set up a ratio of Stable income: Investments in Your Retirement Fund that you are happy with and take your annual expenses out of the pile that is over allocated at the end of the year. In the above case, Investments – From Slack Investor
After 5 years of retirement: Fill your boots. If the first 5 years hasn’t stressed your retirement funds, then things should be fine. There are mandated withdrawals from Super Funds (Aged 65–74: 5%, 75–79: 6%, 80–84: 7%, etc) but, if you are under age 75, re-contribution of any excess funds is a good idea.
Slack Investor has gone down the path of trying to preserve most of the capital in his retirement fund to use as a gift to the next generation or, (I hope not!) an aged care accommodation deposit. He won’t mind a bit of capital shrinkage as he gets older. He anticipates that, after the age of 70, there is more a danger of running out of time rather than money.
April 2026 – End of Month Update
Slack Investor remains IN for Australian index shares, the US Index S&P 500 and the FTSE 100.
All markets had a rebound in April. The rise was modest for the ASX 200 (+2.2%) and the FTSE 100 (+ 2.0%). The ‘Crazy Brave’ US market had strong growth (+ 9.5%) on the possibility of an Iran War ‘deal’ and a return to ships passing freely through the Strait of Hormuz. At the time of writing, this hasn’t happened yet.
All Index pages and charts have been updated to reflect the monthly changes – (ASX Index, UK Index, US Index).