

A few times a year, Slack Investor likes to take a snapshot of the markets using the Cyclically Adjusted Price to Earnings ratios (CAPE) which use ten-year average inflation-adjusted earnings. I first started using CAPE as a “value” tool in September 2021 and, my most recent look was for the end of January 2024. I have decided to do this CAPE market value analysis every few months.
Jeremy Grantham is a well known and astute investor and he argues that recent globalization has benefited the profitability of US companies and that their is good reason for an increasing CAPE trend in the US markets. However, there is some good research that links CAPE to future returns.
The CAPE (cyclically adjusted PE) ratio is not a useful timing signal for market turning points, but is a powerful predictor of long-term market returns
Research Affiliates
By plotting this CAPE over a period of time, we can look at how the whole sharemarket is currently valued in terms of historical data – this way we can track the whole share market as it oscillates between overvalued and undervalued. According to Research Affiliates, CAPE offers a negative correlation with subsequent 10-year and 20-year stock market returns – the higher the current CAPE, the lower are the expected future returns.
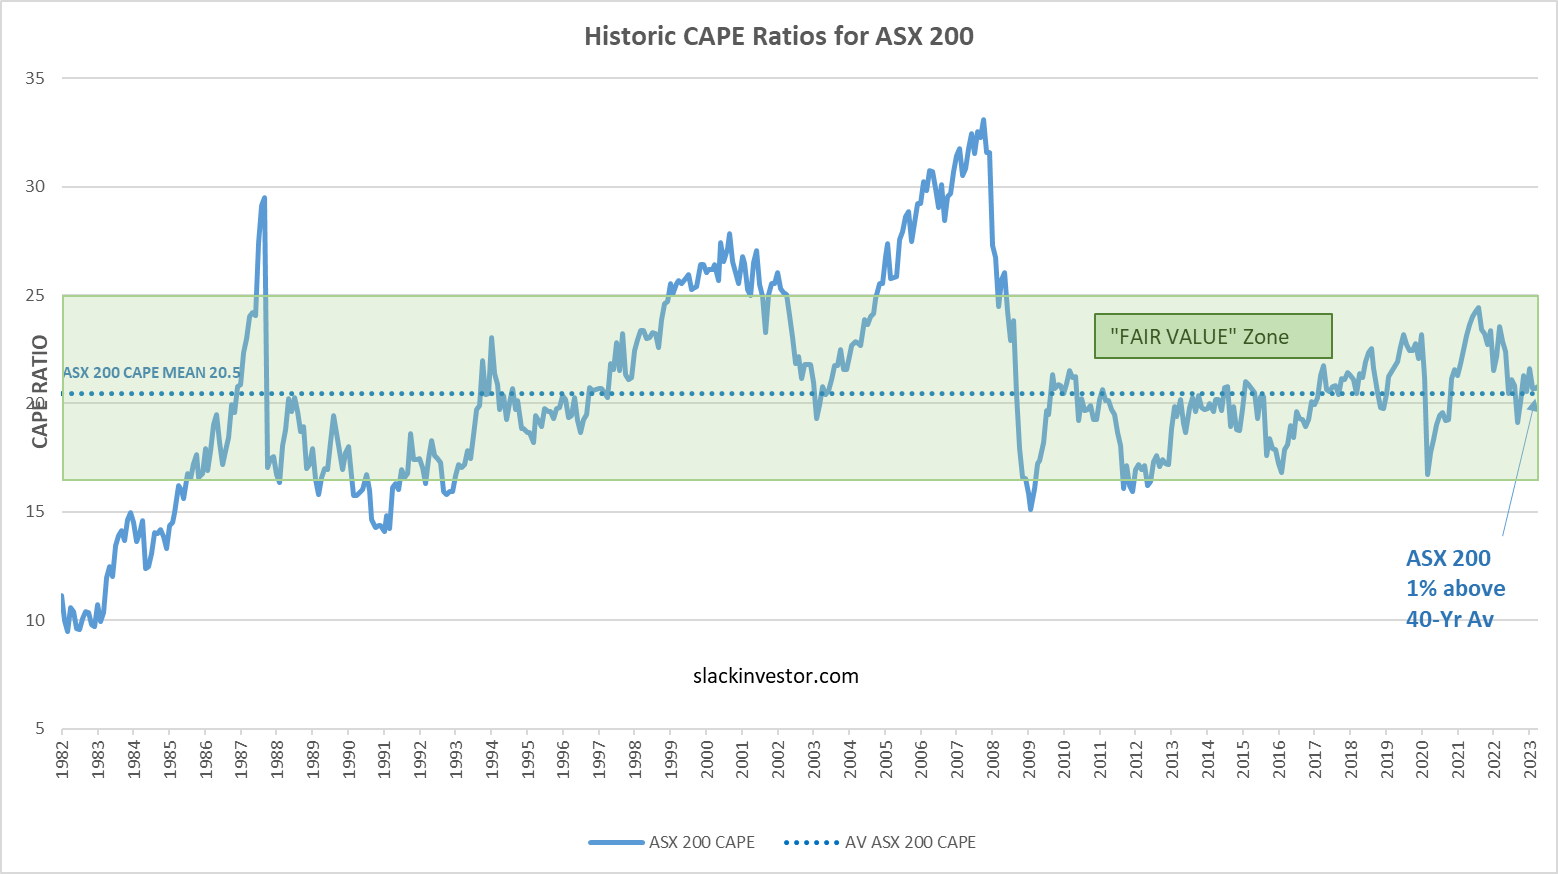
For the following charts, I use monthly CAPE data from Barclays, the 40-yr mean is calculated and plotted together with the latest CAPE values – up till the end of May 2024. A “fair value” zone is created in green where the CAPE is within one standard deviation of the mean (average) – click images for better resolution.
The US market remains the outlier here at 37% above its long-term value. Slack Investor is no guru, but, it doesn’t make sense to him to invest new money into a “frothy” whole-market index like the S&P 500 – at the moment!
ASX 200 Value (4% above long-term value)

FTSE 100 Value (4% below long-term value)

S&P 500 Value (37% above long-term value)

Slack Greetings from Provence – plus Navigational Tips

Slack Investor is in Europe at the moment (Boo … Hiss!), I have just finished a walking holiday in Provence, France. All I can say is that – it is a beautiful part of the world.
Steeped in history and preserved in that remarkable French way that respects the past. We moved around the intricate roads and paths using a fantastic bit of Android/IOS/Windows software called Komoot. The software is free to download on your phone with one local region – and, I added world maps for a one-time lifetime fee of $30 USD about 10 years ago – It was the best money I have ever spent, as I use the app daily. You can plot “tours” that are based upon the comprehensive “Open Street Maps” network which lists all the tiny paths and tracks that rarely appear in Google Maps. The output is best used on your phone – but the app is easier to plan using the desktop version of your Komoot account. I have no financial interest in any of the products that Slack Investor sometimes rambles on about.


Discover more from Slack Investor
Subscribe to get the latest posts sent to your email.