Slack Investor is enjoying the relative calm in the markets over these past couple of days. It is a good time to update the charts for the Cyclically Adjusted Price to Earnings ratios (CAPE). He first started using CAPE as a ‘value’ tool in September 2021 and, the most recent post on Market Value was for the end of December 2024. That feels like such a long time ago – pre-Donald 2.0. The markets have been on quite a ride since then.
Shiller P/E and S&P 500 10-year annualised forward returns from 1983. There is a clear relationship between higher CAPE and lower expected 10-yr returns for the S&P 500. Data valid as of 31 December 2023 – Investco
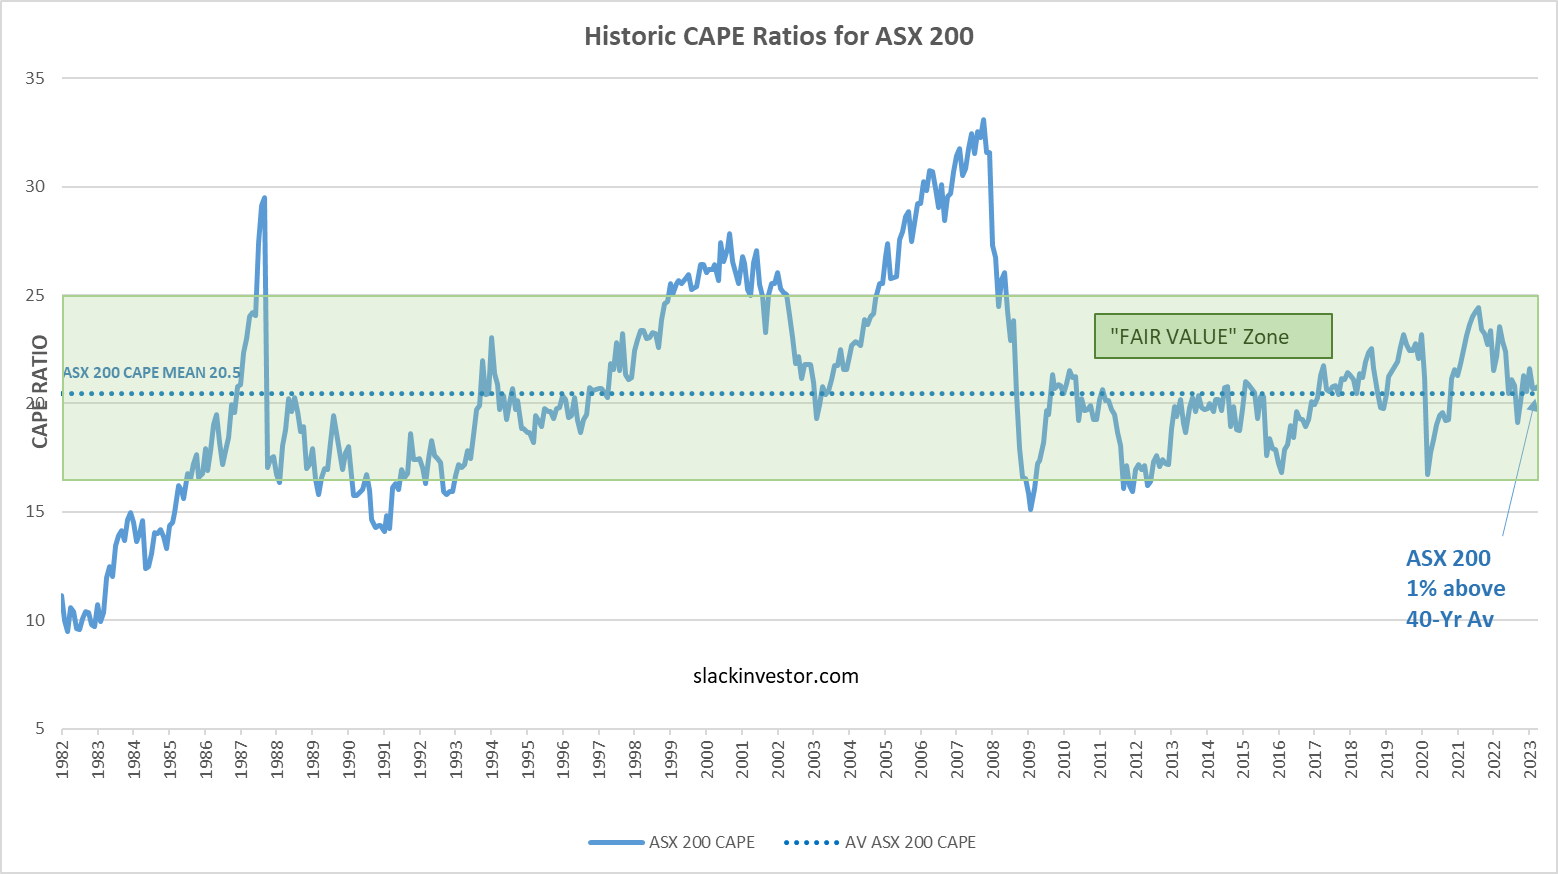
For the following charts, Slack Investor uses monthly CAPE data from Barclays, the 40-yr mean is calculated and plotted together with the latest CAPE values – estimated up until 14 April 2025. A ‘fair value’ zone is created in green where the CAPE is within one standard deviation of the mean (average) – click images for better resolution.
ASX 200 CAPE Value – 3% above long-term av.
ASX CAPE values – estimated up until April 14 2025
FTSE 100 CAPE Value – 10% below long-term av.
UK CAPE values – estimated up until April 14 2025
S&P 500 CAPE Value – 32% above long-term av.
US CAPE values – estimated up until April 14 2025
Market value and Market Timing Experiment
The ASX 200 and the FTSE 100 are both within 10% of their 40-yr CAPE average. When within the green ‘fair value’ range, Slack Investor has patience and he will be assessing these charts at the end of the month.
The US index chart was, and still is. above the ‘fair value’ range and Slack investor had the S&P 500 on a weekly check. Last week it plunged below the stop loss and Slack Investor sold. These are early days in the Trump 2.0 experience – given current form, there will be more surprises.
The US Index is just a small part of the Slack Portfolio (1.6%). The bulk of his portfolio is currently riding the market roller coaster – patiently in search of long-term returns.
Apologies for intruding into your inbox. I like to keep the Slack Investor blog folly to twice a month. But these are unusual times.
The Slack Investor Market Timing Experiment
Slack Investor started his ‘index-timing’ strategy in 2004 with the ASX Index, UK Index, US Index. An earlier version of Slack Investor thought that by monitoring the market at weekly and monthly intervals and setting ‘stop losses’ to know when to sell the index. To know when to buy, he used a momentum indicator called the Directional Movement Index.
Although, there was some initial success over the ‘buy and hold’ strategy, the benefits work out to be quite small on a yearly basis. For example, for the Australian Index there is a 1.2% p.a. outperformance for Slack market timing strategy over ‘buy and hold’.
These relatively small gains would have probably been offset by earned share dividends if I was using the alternative ‘buy and hold’ strategy. Market timing works well when there are sustained periods of bull and bear markets and the changes between the two are not too rapid. The short transitions and the speed of market fluctuations in the last 20 years has forced a bit of a rethink on Slack Investor’s timing the markets strategy.
Instead of monitoring the markets monthly, he has been looking for weekly changes as well. He is also taking the current market value and recent trends into account. Slack Investor is a man of routine and he has now decided to keep the experiment going for 25 years (till 2029). After this, he will probably go for the more appropriate Slack Investor method of doing nothing and adopting a ‘buy and hold’ technique for index funds (ASX Index, UK Index, US Index).
At the end of the past week, Slack Investor conducted a review of the Index charts and noted that the US Index price has slipped below the stop loss (thick red line). As the trend is still downward, and the market is overvalued (see below), it is time to get out. As part of this experiment, I will sell my small holding of S&P 500 Index tomorrow and update the US Index page.
US CAPE values – up till the end of March 2025 showing the index is still overvalued (at March 31). The CAPE ratio is above the green zone.
What about the rest of the Slack Portfolio?
Deep down, Slack Investor doesn’t believe he is very good at timing the markets. The bulk of the Slack Portfolio (97%) is not in index funds, but in growth companies – that are taking a bit of a beating at the moment. That’s what the stock market does in times of uncertainty.
Mostly, Slack Investor will be doing nothing. He will try and distract himself from the self-destructing behaviour of Trump. I cannot remember a time where the whole world was so united in its resolve against the USA. Slack Investor knows that good times (and prices) will return. Slack Investor has his Stable Income Portfolio if he needs cash.
The worst thing to do, from a long-term wealth perspective, is to convert shares to cash in a down market – Slack Investor (and other wise investors!)
On the back burner is my project to sell some of the Slack Investor owned companies with a relatively lowSlack Factor – and invest more in those with a highSlack Factor.
A WordPress AI generated weird image that reassuringly does not make any physical sense.
Reporting Season
During February, most companies report on their progress up to the end of December. There is a similar reporting season in August for the period up to 30 June. Once all the analyst projections for future earnings are in, it is a good time to update the state of play for companies in the Slack Portfolio.
It took a while for Slack Investor to understand that a company could come in with a great report on the business and still, the price of the shares might go down. This is because reporting season is all about expectations. If a company was expecting an increase in earnings of 22% – and they ‘only’ achieved 20%, the share price is likely to get knocked down on the announcement.
As the Slack Portfolio consists of mostly growing stocks with a relatively high Price to Earnings Ratio. The growing stocks usually have high prices as the company’s growth is priced in. These stocks can get punished severely when an earnings target is missed – price falls of 10-20% are not uncommon. But, it is long term results that really count and Slack Investor is willing to endure any short-term pain for a growing company. This period of ‘Trumpenomics’ is an example of such a time.
Slack Investor uses the excellent Market Screener site (requires email registration) to get information from the Financials tab for each company. Analyst information is not available for ETF’s so, only data on the individual companies that are in the Portfolio is gathered.
In the table below, information is listed for the forecast P/E Ratio (PE 2027), the forecast Return on Equity (ROE 2027), the forecast Earnings Per Share Growth (EPSG 2025) (EPSG 2026) (EPSG 2027) and the average of the three Earnings Per Share Growth figures (EPSG AV). There is some fudging of the figures as some of the forecast EPSG figures were unavailable. Also, for some of the companies that are new to profit, their EPSG figures are skewed – I have limited the EPSG (AV) to a maximum of 50. I have ranked the companies in order according to their Slack Factor.
The Slack Factor
What is the Slack Factor? It is well known that Slack Investor likes
Profitability – measured in terms of the forecast Return on Equity – ROE 2027
Growth – measured as the average forecast Earnings Per Share Growth – EPSG (AV) for the three years 2025, 2026 and 2027.
It is well known that Slack Investor does notlike
High Price to Earnings Ratios – measured in terms of the forecast Return on Equity – PE 2027. Sometimes, great companies are just too expensive.
ROE is the forecast ROE (ROE 2027), EPSG is the forecast EPSG for the next three years (EPSG AV) and, PE Ratio is the forecast PE Ratio (PE 2027).
So, things he likes go on the top line and the things that he doesn’t like go on the bottom line. This reduces a lot of the complicated information in Slack Investor’s tiny brain to one number. He has made no attempt to scale (normalise) each input into the Slack Factor. It is just a simple way to rank companies with qualities that he thinks are good. The bigger the number, the more likely the company has attributes that Slack Investor likes – profitability, growth and a price tag that is not too expensive. With these traits … surely good things are more likely to happen?
The fast growing Telix Pharmaceuticals (TLX) is a company that Slack Investor is a fan of, and it has a high Slack Factor of 52. The growth dullard Commonwealth Bank (CBA) has a Slack Factor of only 3 – and, is of no interest to Slack Investor.
Name
Symbol
PE 2027
ROE 2027
EPSG 2025
EPSG 2026
EPSG 2027
EPSG (AV)
SLACK FACTOR
Telix Pharmaceuticals
TLX
25
26
230
70
30
50
52
REA Group
REA
40
32
98
11
17
42
34
Codan
CDA
19
23
20
23
18
20
25
Alphabet (US)
GOOGL
15
25
12
14
16
14
23
Supply Network
SNL
29
38
23
14
15
17
23
Megaport
MP1
50
19
-9
160
40
50
19
Pro Medicus
PME
115
53
40
42
30
37
17
WiseTech Global
WTC
42
20
32
38
34
35
17
Technology One
TNE
48
34
18
20
19
19
13
CSL
CSL
20
18
12
15
16
14
13
Goodman Group
GMG
18
11
34
12
20
12
Coles Group
COL
18
32
-2
17
5
7
12
RPM Holdings
RUL
38
18
10
25
40
25
12
XRF Scientific
XRF
20
18
17
11
11
13
12
CAR Group
CAR
28
15
35
18
12
22
12
ResMed
RMD
20
23
9
10
11
10
12
Wesfarmers
WES
24
33
3
13
9
8
11
Nick Scali
NCK
15
29
-28
29
14
5
10
Cochlear
COH
34
25
15
7
16
13
9
Macquarie Group
MQG
15
13
6
18
8
11
9
Botanix Pharma
BOT
Not
Ranked
–
Not
Enough
Info
Over the next quarter, I will try and sell some of the Slack Investor owned companies with a relatively low Slack Factor – and invest more in those with a high Slack Factor. For homework, using Market Screener, try to work out the Slack Factor for some of the companies in your own portfolio.
March 2025 – End of Month Update
The current ‘Trump Slump’ in stock prices can be attributed to the largest upheaval to global trade since the Second World War – Thanks Donald! All followed markets fell this month. The ASX 200 down 4.0%, the FTSE 100 down 2.6%, and the S&P 500 down 5.8%. For now, each Index remains above their stop losses. Slack Investor remains IN for the FTSE 100, the ASX 200, and the US Index S&P 500.
Slack Investor took the opportunity to tighten up his stop loss values for the FTSE 100 and the ASX 200. On the UK Index chart below, by drawing a black wavy line under the monthly minimum values, it can be seen that some new ‘higher lows’ have been established. It made sense to move up the stop loss to the most recent ‘higher low’.
All Index pages and charts have been updated to reflect the monthly changes – (ASX Index, UK Index, US Index). The quarterly updates to the Slack Portfolio have also been completed.
Goldfinger, the Bond film from 1964, portrays a scene where a woman is covered in gold and dies from ‘skin suffocation’. Slack Investor notes that gold has had a good recent run and hopes that those involved with gold continue to prosper.
Is Gold Good?
A lot of people think so – and, it has performed well lately.
The price of gold exceeded US$2,900 an ounce last week for the first time. Since October 2023, it has risen by more than US$1,000 an ounce. The price is three times higher than it was a decade ago. – Tom Stevenson, Fidelity – Livewire, February 2025
Gold does well as a hedge against inflation and, in times of uncertainty. The chart over the past 10 years looks pretty good.
There is no doubt that gold has been successful during market crashes in the past – and it will decrease your portfolio volatility. But, usually, it can also drag the portfolio down when times are good in the markets. Unusually, since 2023, gold has increased greatly at the same time that stock markets have also done well. Something weird is going on!
Gold makes sense for investors that sleep better at night knowing that at least some part of their portfolio is going up during times of market stress. Gold might also help to avoid selling your investments during a downturn – when the shares are undervalued! You could sell the gold for income during a market crash.
Slack Investor has his own plan for these down times – the Stable Income pile.
Does Gold appeal to Slack Investor as an investment?
Firstly, gold would not get a guernsey in his Stable Income pile as it does not produce any income by itself.
Only a Goldsmith Knows the Value of Gold – Old Turkish Proverb
Despite the sound arguments for gold, Slack Investor just can’t bring himself to put gold in the Slack Portfolio – the Investment pile. The big problem he has, is that Slack Investor has no idea whether the current price for gold is a fair reflection of its value – it has had a big run lately – is it overvalued? At least when he is buying stocks, he can have a look at the company’s earnings and get an idea of whether the company is cheap, or expensive, by comparing its projected price to earnings (P/E) ratio.
This is Slack Investor’s difficulty with all non-income producing assets – these include precious metals, artworks and even cryptocurrency – there is no way to determine their actual value. The price of these speculative assets is only defined by what the next person will pay for them. So, none of these types of assets will appear in the Slack Investment Portfolio.
Slack Investor will continue to take his chances with stocks that are growing, predicted to grow further, and producing income. His investment portfolio will be more volatile for not having gold – but, it is the long-term performance that counts the most with Slack Investor.
Slack Investor hopes to never draw down on his investments in the lean years when his stocks are undervalued. He has his Stable Income pile (currently 22% of total retirement funds) to get him through the periods when his Investment pile might go negative. The Stable Income fund target is to earn a little above the inflation rate. The Slack Investment fund has more ambitious goals and the pursuit of growing stocks (without gold) might have more ups and downs – but, so far it’s working!
5-yr Return
10-yr Return
15-yr Return
13.4%
15.7%
14.8%
Slack Investment Portfolio long-term annual compounding average returns. Pre-tax annual average returns till the end FY24.
February 2025 – End of month update
Slack Investor is IN for Australian index shares, the US Index S&P 500 and the FTSE 100.
February has continued well for the UK Index, the FTSE 100 is up 1.6 %.
The S&P 500 (-1.4%) has had a bit of a pull back and the ASX 200 is down 4.2%, erasing its January gains.
All Index pages and charts have been updated to reflect the monthly changes – (ASX Index, UK Index, US Index).
In the middle of 2024, Slack Investor had some cash from the sale of Altium (ALU) that needed investing. He had spread the amount into buying into some companies that he already had (TNE, CAR, SNL, NDQ, PME, TLX). He also brought in some new blood (WEB, MP1, NCK, RMD, JNDQ, BOT, RUL, DHHF). The new companies were picked because he hoped that they were in the ‘growing stage’ – to replace the growth superstar ALU.
As with most things, some have worked well – and some not so well. The real duds were associated with Webjet (WEB) and its subsequent spin-offs. He also dumped his small holding of Megaport (MP1) – but, he is now having a rethink about MP1. As the Slack Portfolio is fully invested at the moment, to buy something, he must first sell something.
BetaShares Diversified All Growth ETF (DHHF)
This was the last thing that Slack Investor bought on his 2024 buying spree and, to be honest, he didn’t look to0 deeply into it. Slack Investor was initially impressed by the simplicity of an All Growth ETF at a low management fee (0.19%). DHHF has done very well since purchase (+11%). The ETF is certainly diversified but, he is wondering whether the All Growth, as it says on the label, means that it is growing.
DHHF is a bundle of four low cost funds. The funds are:
The percentage allocation, on 24/01/2024, with the Management Expense Ratio (MER) of the underlying funds is shown below. Betashares have done a good job to ensure the underlying funds have very low fees (MER).
ETF
% Allocation
MER (%)
VTI
42.0
0.03
A200
37.1
0.04
SPDW
15.0
0.03
SPEM
5.7
0.07
Slack Investor must admit to a misunderstanding when he bought DHHF – he thought All Growth meant he was buying a selection of growing companies. It is only when he read the accompanying Product Disclosure Statement that he realised that All Growth was in reference to the fund being almost 100% in growth assets (shares or property). They are using All Growth as a descriptor to investing style. The All Growth assets make this fund suitable for those who have a high tolerance for risk. Betashares recommend a holding period of at least 7 years.
Does Growth mean Growing?
Not necessarily. This can be confusing – it was for Slack Investor! He has been guilty of using these terms interchangeably. Growth can be used as an investment style description – indicating the asset mix and amount of risk. The more shares and property in the mix, the higher the risk (chance of negative returns). According to Investsmart, typical mixes for funds are:
High Growth: around 100% in shares or property.
Growth: around 85% in shares or property, and 15% in fixed interest or cash.
Balanced: around 70% in shares or property, and 30% in fixed interest and cash.
Conservative: around 30% in shares and property, and 70% in fixed interest and cash.
Cash: 100% in bank deposits or ‘capital guaranteed’ products.
Of course, Slack Investor should have fully read the DHHF PDS before his purchase – a rookie error! Because he also has a stable income portfolio, the ‘riskiness’ of DHHF didn’t bother Slack Investor. However, his favourite companies to fill the Slack Portfolio are those that are having earnings that are actually growing or, are projected to grow, at least 10%.
A big portion of DHHF consists of the ASX 200 (37.1%). Slack Investor owns a small holding of the Australian Index and, he acknowledges that it is a fantastic part of any income portfolio – as it is a great source of dividend imputation income. However, he has never really been a big fan of the ASX 200 in the growth-based (or, should I say, growing-based) Slack Portfolio.
The ASX 200 is a mixture of ‘Duds’ (shrinking companies, decreasing earnings), mature companies (companies in steady state – earning but not really growing) and, companies that are increasing earnings and actually growing.
In the ASX 200, seven of the top ten holdings are either banks or mining companies – these types of companies are not known for growing every year at above 10%. For example, the top ASX 200 holding is the Commonwealth Bank (CBA). According to the Market Screener site, CBA’s 2024 Earnings Per Share (EPS) growth was -4%. For 2025 and 2026, growth is projected to be 5% and then 4% p.a.
Slack Investor rates Betashares DHHF to be an excellent ETF for diversified share exposure at a relatively cheap cost. It definitely qualifies as High Growth as it consists of nearly 100% in shares or property. However, Slack Investor would rather concentrate on companies that are actuallygrowing. He will sell DHHF and use the cash to buy something else.
January 2025 – End of month update
Slack Investor is IN for Australian index shares, the US Index S&P 500 and the FTSE 100.
The new year has started well, particularly for the UK and Australia where, the FTSE 100 is up 6.1 %, and the ASX 200 up 4.6% in January.
The S&P 500 (+2.7%) is relatively subdued after the monster 25% gains of 2024.
All Index pages and charts have been updated to reflect the monthly changes – (ASX Index, UK Index, US Index).
Boring isn’t it. How Slack Investor goes on and on … and on and on … about long-term returns. But firstly, some short-term returns. All numbers are in for 2024 and the Slack followed markets all had an ‘above average’ year when dividends are included. The average returns are based upon the 2024 Vanguard Index chart 30-yr returns and, for the FTSE, the 20-yr return.
Index
2024 Index Return
2024 Total Return (inc. Div)
Av. Yearly Total Return
ASX 200
7.5%
11.4%
9.1%
FTSE 100
5.7%
9.7%
6.9%
S&P 500
23.3%
25.0%
11.1%
The beautiful histogram of annual ASX 200 (and proxies) returns (that include dividends) from MarketIndex.com.au has been updated for 2024. Slack Investor is always pleased with an addition on the positive side of the ledger – he notes that there are many more positive years than negative – this also helps his disposition.
Historical Annual Returns of the ASX 200 (including dividends) – Source: MarketIndex.com.au
A similar pattern with the S&P 500.
The last 151 years of annual returns (without dividends) for the S&P 500 Index – From visualcapitalist.com
For both the S&P 500 and the ASX 200, 19% of calendar years delivered a negative return. Therefore, on average, we can expect a negative return for one in every five years.
2025 Predictions?
Slack Investor is no seer. The Financial Press has come up with a range of views for 2025. In a very 2025 move, Slack Investor asked the AI Bot Perplexity for its predictions for the S&P 500 for 2025.
Based on various Wall Street analysts’ predictions, the S&P 500 is expected to deliver positive returns in 2025, with estimates ranging from approximately 9% to 20%. – Perplexity
From experience, Slack Investor knows that the financial press predictions are not very good. Perplexity cautions that the past S&P 500 predictions have generally been inaccurate and unreliable.
Whatever 2025 brings, Slack Investor will take the short-term returns on the chin – he does rely on positive returns in the long-term. As the chart below indicates. If you held a World Index Fund such as Vanguard MSCI Index International Shares ETF (VGS) for 5 years, you would expect positive returns on 88% of occasions. Longer holding periods will almost certainly yield you positive returns. VGS has a relatively low management fee of o.18% and does not hold Australian shares.
The incomparable cartoonist David Rowe capturing Donald Trump in the Australian Financial Review taking the Republican party for a swim in the sewer.
The Clown in Chief – Stable Genius? Great Investor?
Far be it for Slack Investor to disparage the wisdom of the majority of voting Americans that have just elected Donald Trump for four years as their president. Despite Trump declaring himself as a ‘stable genius’, my mother wisely used to say that ‘Self-praise is no recommendation’.
There is some contention on how much was available in ‘free cash’ but, if the available amount was invested in S&P 500 stocks in 1974, PolitiFact estimate that it would be worth at least $3 billion today. Using different initial estimates, the National Journal estimates that passive investing in stocks could have enriched Donald by $US8 billion. So, it seems that Donald was destined to be a billionaire – whether investing in real estate – or the stock market.
“Bloomberg puts Trump’s current net worth at $2.9 billion, Forbes at $4.1 billion. The National Journal has worked out that if Trump had just put his father’s money in a mutual fund that tracked the S&P 500 and spent his career finger-painting, he’d have $8 billion.” – Source: National Journal
To further harp on about the miracle of compound interest , there are huge advantages in starting to invest at an early stage. The chart below contrasts the case of Investor 1 at age 25 and investing $5000 per year for 10 years – then stopping, and allowing the compounding interest to do its work. Investor 2 doesn’t start his investing quest till the age of 35, and invests $5000 per year for 30 years. He never catches up to Investor 1.
Of course, Slack Investor is all about personal empowerment and the chart above rings the bell on starting your investment journey as soon as possible. In the journey of life, you may be one of the lucky ones to receive a gift or inheritance along the way – this advantage is huge! Slack Investor acknowledges his privilege and was given a gift from his grandfather’s estate equivalent to 30% of a year’s salary in his early thirties. The gift went straight on my mortgage.
This makes Slack Investor ponder about the help that a monetary gift can bring. Slack investor is all for self improvement, through education or travel. However, if given a gift of money, he would recommend, at least, using a good portion of it to reduce any debt – or invest. But do it now.
December 2024 – End of Month Update
OK, someone must have been naughty! The year closes and there was no December ‘Santa Rally’ this month. All followed markets fell. The ASX200 down 3.3%, the FTSE100 down 1.4%, and the S&P500 down 2.5%. Slack Investor remains IN for the FTSE100, the ASX200, and the US Index S&P500.
I haven’t yet done the maths on the market yearly gains that include dividends. In raw terms, for calendar year 2024, the ASX 200 was up 7.5%, the FTSE 100 up 5.7%, and the S&P 500 up 23.3%.
All Index pages and charts have been updated to reflect the monthly changes – (ASX Index, UK Index, US Index). The quarterly updates to the Slack Portfolio have also been completed.
A few times a year, Slack Investor likes to take a snapshot of the markets using the Cyclically Adjusted Price to Earnings ratios (CAPE) – which use ten-year average inflation-adjusted earnings. He first started using CAPE as a ‘value’ tool in September 2021 and, the most recent post on Market Value was for the end of May 2024. That was 6 months ago and, probably due to the strange ‘Donald 2.0’ effect, the US and Australian markets have powered on since then.
Shiller P/E and S&P 500 10-year annualised forward returns from 1983. There is a clear relationship between higher CAPE and lower expected 10-yr returns for the S&P 500. Data valid as of 31 December 2023 – Investco
The CAPE (cyclically adjusted PE) ratio is not a useful timing signal for market turning points, but is a powerful predictor of long-term market returns.
For the following charts, Slack Investor uses monthly CAPE data from Barclays, the 40-yr mean is calculated and plotted together with the latest CAPE values – up till the end of November 2024. A ‘fair value’ zone is created in green where the CAPE is within one standard deviation of the mean (average) – click images for better resolution.
ASX 200 CAPE Value 23.0 (12% above long-term av.)
ASX CAPE values – up till the end of November 2024
FTSE 100 CAPE Value 16.3 (7% below long-term av.)
UK CAPE values – up till the end of November 2024
S&P 500 CAPE Value 37.7 (52% above long-term av.)
US CAPE values – up till the end of November 2024
What is Slack Investor doing about the high US market values?
The CAPE ratio is a helpful way for Slack Investor to look at the current state of the markets – it doesn’t change his approach to investing. He will just stick to his guns with his tried and true investment strategy.
Invest in a range of companies using ETF’s or a portfolio of at least 15 stocks.
For the individual stocks, continually monitor these investments to make sure that they still have some competitive advantages (e.g. A Moat), generate sustainable profits, they are continuing to grow and predicted to grow further.
These type of companies should do OK over most market cycles.
Slack Greetings from the UK – an ode to English Pubs
Slack Investor is not really much of a cold season traveller but he is here in the UK for some family business. England in winter is pretty grim with short days and cold weather. However, there is joy in slipping into a great English pub with a fire going and conversation everywhere. Experience tells me that most English pubs are good. But, he wasn’t just in any pub – Slack Investor was drinking at the RAF bar of The Eagle in Cambridge. Famous for being the pub where Francis Crick and James Watson (based on the work of Rosalind Franklin and others) celebrated and announced the double helix structure of DNA in 1953. Long live the English Pub.
The Eagle, Cambridge, UK. Long live the English Pub.
My Dad was an amateur finance bloke and would often spend the quiet hours of the night with a notebook and reading matter that would usually have the theme of unlocking great wealth for his family. One of his sayings was:
‘Money Makes Money’ – My Dad
We were from a large family and there were always sufficient ‘outgoings’ to make sure that my Dad never really got to test the theory on his own funds. But, he believed that if only he could amass a chunk of money, then this could be invested wisely and, it would keep on growing and, he would never have to worry about money, ever again!
He had seen many examples of the rich getting richer. People with money increasing their wealth in a seemingly effortless fashion e.g. A Sydney harbourside home bought for $10 million selling for $26 million four years later. He was also a fan of Noel Whitaker and bought one of the first editions (in 1987!) of Noel’s great book Making Money Made Simple. My Dad understood the simple truth of saving more than you earn, investing these savings and letting the compounding do its work over time. Although it takes more time than harbourside investing, Noel’s advice still holds up.
I have since learned that my Dad might have got the ‘money’ quote from Benjamin Franklin who, expresses the full beauty of the compound interest process.
“Money makes money. And the money that money makes, makes money.” – Benjamin Franklin
So, it is not only the money that you invest, but all the earnings are earning too.
The one-eyed political investor
Let’s suppose you were such a committed US political investor that you only had funds in the market when ‘your president’ was in power – and, quickly withdrew your investments when the other team got in. Using 70 years of S&P 500 data shows that you might be better off if you were a Democratic investor. However, your gains would be tiny compared to the situation where you were more relaxed and just kept your money in the market – regardless of President. The lesson is, that time in the market is the key.
Investing in the US S&P 500 index from Jan 1953 to September 2024- Source Financial Synergies
It is time in the market that matters – not who you vote for!
The following pair of charts presents another way of looking at the effects of one-eyed political investing, either Democrat or Republican, over a 10-yr time frame and also, a 70-yr period. The time periods are different to the above chart and hence the different final dollar totals.
If you invested ONLY when your political party was in power, you would be much worse off.
Using S&P 500 and proxy data for 10 years and 50 years till December 2023 – Source: Steelpeak Wealth
Slack Investor has seen the shape of the green curve on the right hand side before. It echoes the hundreds of compound interest charts that I have looked at for inspiration. It starts flat and then rapidly increases with time.
“Compound interest is the eighth wonder of the world. He who understands it, earns it; he who doesn’t, pays it.” – attributed to Albert Einstein
Let’s say you managed to save $10 000 per year and you invested the money with an average return of 10%.
The blue line indicates the value of investing $10 000 p.a. and, compounding over 30 years. The green circle is where your interest earnings start to exceed the amount of your own money invested – Source: A Wealth of Common Sense
The brown line shows savings of $10 000 p.a., for 30 years, amounting to $300 000 of your money. The grey line represents the total compound interest on your investments. For the first 15 years you think you are getting nowhere – then the compounding kicks in with the help of time – your money plus earnings on that money plus time. Using the above assumptions, the total accumulated amount would be over $1 660 000.
The 10% earnings seems a little wishful. Although, past 30-yr averages for US shares, International shares, Australian stocks and Australian Listed property are, respectively, 11.1%, 8.2%, 9.1%, 7.8%. If your investments averaged 8% p.a., the total value of your investments would be $1 233 449 – Not Bad! However, life is not really like an Excel spreadsheet.
Slack Investor’s case study of compounding
A real-life example of compounding returns can be found in Slack Investor’s own tracking of Net Worth. He has diligently tracked his Net Worth (Assets – Liabilities) for 34 years since 1990 using the free software Microsoft Money Sunset International Edition. There is no magic in this chart – except for the miracle of compounding! As a family, we achieved a savings rate (including superannuation) that varied between 20% and 45%p.a. of take home salaries. During this time we have had home loans and have always been investing.
Slack Investor’s (+Ms SI) Monthly Net Worth Chart over the 34 years of saving and investing since 1990 – Microsoft Money
Even though Slack Investor is familiar with the concept of compounding interest – he is continually astonished with the spectacular gains in net worth over the latter years.
My Dad was right … Money makes Money! Start saving and investing now and get on this ride!
November 2024 – End of month update
Slack Investor is IN for Australian index shares, the US Index S&P 500 and the FTSE 100.
To Slack Investor’s bewilderment, in what can only be described as a ringing endorsement for Trump economic policies, the S&P 500 raged ahead by 5.7 % in November.
For the ASX 200 (+3.4%) and the FTSE 100 (+2.2%) – it has also been a great month.
Dramatic falls in a stock price … are not very nice. However, they are part of the game when investing in growth stocks. These falls usually come during reporting season. This is sometimes known as ‘confession season’.
ASX-listed companies are all required to report their earnings within two months of June 30 and December 31. The half-year reports are usually floated into the market during August and February – and this is the main time that the confessions come in. ASX companies can also give quarterly updates and, they are strictly bound by ‘Continuous Disclosure’. This is where they are obliged to promptly announce any new information that may affect the stock price.
Once an entity becomes aware of any information concerning it, that a reasonable person would expect to have a material effect on the price, or value of the entity’s securities, the entity must immediately tell ASX that information – ASX Continuous Disclosure Guide
When bad news comes in, there will be an announcement and there is usually a fall in stock price. Most of the time, bad news comes in the form of an earnings forecast not being met – an earnings downgrade. It is time for Slack Investor to get off the couch.
Slack Investor is not a ‘Day Trader’ and, also Slack! This means that he doesn’t get wind of a dramatic fall in one of my holdings till the end of the day. Sometimes it is even days after the event.
This gives him time to think about what to do next, and there are two schools of thought.
Accept the loss and sell the stock to employ your funds elsewhere – as bad news often comes as a series.
Reassess the numbers on the company and ask ‘Would you invest in this company today at the current price?‘
Experience tells Slack Investor that he is usually better off with option 1 – and investing the proceeds with a, hopefully, price increasing stock.
Recent Case Studies from the Slack Investor Rogue File
This was a sudden fall from grace as it was bought in August 2024. There was an earnings downgrade and it was an easy decision to get out – as no ‘love’ had been developed for the company. Slack Investor was wrong on his understanding of this companies earnings growth.
Webjet (WEB,WJL)
This is a complex one. Slack Investor recently bought Webjet (WEB) at around $9 on the basis of their fast growing internet business WebBeds – and its seemingly good projected numbers. In September 2024, Webjet went through a demerger that split the business into its retail Travel Agent (Webjet Group – WJL.ASX) and its global Business to Business booking site, mostly WebBeds, (WEB Travel Group – WEB.ASX). Webjet announced a profit warning on 14th October and the share price plummeted 35% in a day. Whoops!
Slack Investor planned to sell WJL, the retail travel agent part of the business (not a high growth sector), and keep the growing (+22% CAGR) demerged WebBeds (WEB). This might be a good business one day – but the big 35% drop spooked him and he sold them both for a combined price of $4.80. Ouch!
Slack Investor thinks this is a good growing business but they had some revenue shortfalls that caused a 19% 1-day price drop in 2022. He probably should have got out then. However, he has grimly stuck with them and, after 2 years of falling stock prices, they seem to be on the right track. It remains in his portfolio.
After a 16% fall in a day in May 2024, Slack Investor reassessed the numbers on this stock – a projected 2026 PE of 16 and an ROE of 39%. The numbers looked pretty good – and he held on. However, the last two years of revenue growth have been 2% and 4% respectively. Slack Investor is not sure what is going on … but this company has not been growing. He sold at $8.69 this week.
Taking a loss … and moving on
This is a real skill – that doesn’t come easily – but is essential for managing a portfolio of growth stocks. Slack Investor is better at this than he used to be. Usually, growth stocks will come with a high Price/Earnings ratio as the future earnings growth will be factored into the price of the stock. These type of companies are particularly susceptible to a rapid decline in price when bad news emerges that might affect future earnings.
“Some people automatically sell the ‘winners‘— stocks that go up— and hold on to their ‘losers‘— stocks that go down— which is about as sensible as pulling out the flowers and watering the weeds” – Peter Lynch – One Up On Wall Street
Slack Investor tries to adhere to the Peter Lynch philosophy when tending to his garden of stocks. He doesn’t always get these decisions right – but he does find it ‘cleansing’ to get rid of the bad performers. With experience, he has found that, more often than not, if there is a dramatic 1–2 day fall in a stock price (>15%) – it often takes a while to recover! Slack Investor is usually happy to take the loss and move his funds elsewhere. There is ‘opportunity cost’ in staying with a stock that is going nowhere.
Despite these bad performers, he doesn’t beat himself up about them. It is just part of investing. He takes solace that his whole portfolio is up about 8% in the 4 months of this financial year – and he does have good long-term results.
With the money raised from selling the dud investments, he bought into quality earnings with half the proceeds topping up his Supply Network (SNL) holding. The rest went into a new stock that he has been watching for a while – the logistics software business WiseTech (WTC).
The company had a price drop over a saucy scandal involving the founder and CEO Richard White. He resigned and Slack Investor is betting that these private-life dalliances should not interrupt the fine profitability (ROE 2026 20%) and established revenue growth (1-yr 2024 CAGR 20%) of this great Australian company.
Slack Investor is IN for Australian index shares, the US Index S&P 500 and the FTSE 100.
All markets drifted down slightly. As many of the big market crashes have occurred in September and October, Slack Investor is always relieved to get past this time of year.
For October, the ASX 200 (-1.3%), the FTSE 100 (-1.5%) and the S&P 500 (-1.0%).
All Index pages and charts have been updated to reflect the monthly changes – (ASX Index, UK Index, US Index).


