Slack Investor is enjoying the relative calm in the markets over these past couple of days. It is a good time to update the charts for the Cyclically Adjusted Price to Earnings ratios (CAPE). He first started using CAPE as a ‘value’ tool in September 2021 and, the most recent post on Market Value was for the end of December 2024. That feels like such a long time ago – pre-Donald 2.0. The markets have been on quite a ride since then.
Shiller P/E and S&P 500 10-year annualised forward returns from 1983. There is a clear relationship between higher CAPE and lower expected 10-yr returns for the S&P 500. Data valid as of 31 December 2023 – Investco
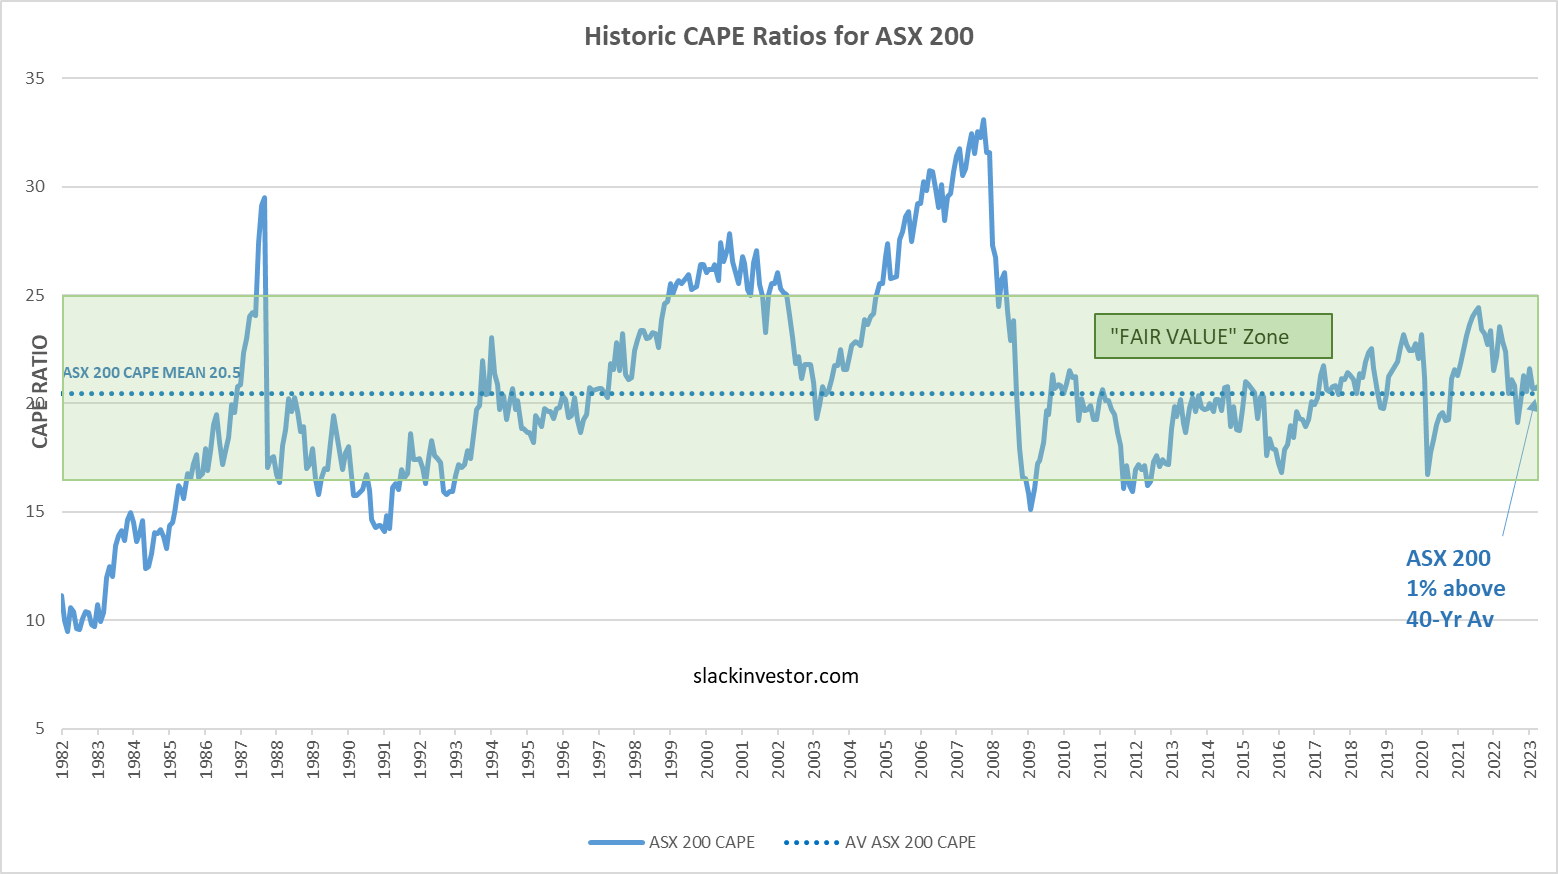
For the following charts, Slack Investor uses monthly CAPE data from Barclays, the 40-yr mean is calculated and plotted together with the latest CAPE values – estimated up until 14 April 2025. A ‘fair value’ zone is created in green where the CAPE is within one standard deviation of the mean (average) – click images for better resolution.
ASX 200 CAPE Value – 3% above long-term av.
ASX CAPE values – estimated up until April 14 2025
FTSE 100 CAPE Value – 10% below long-term av.
UK CAPE values – estimated up until April 14 2025
S&P 500 CAPE Value – 32% above long-term av.
US CAPE values – estimated up until April 14 2025
Market value and Market Timing Experiment
The ASX 200 and the FTSE 100 are both within 10% of their 40-yr CAPE average. When within the green ‘fair value’ range, Slack Investor has patience and he will be assessing these charts at the end of the month.
The US index chart was, and still is. above the ‘fair value’ range and Slack investor had the S&P 500 on a weekly check. Last week it plunged below the stop loss and Slack Investor sold. These are early days in the Trump 2.0 experience – given current form, there will be more surprises.
The US Index is just a small part of the Slack Portfolio (1.6%). The bulk of his portfolio is currently riding the market roller coaster – patiently in search of long-term returns.
In the middle of 2024, Slack Investor had some cash from the sale of Altium (ALU) that needed investing. He had spread the amount into buying into some companies that he already had (TNE, CAR, SNL, NDQ, PME, TLX). He also brought in some new blood (WEB, MP1, NCK, RMD, JNDQ, BOT, RUL, DHHF). The new companies were picked because he hoped that they were in the ‘growing stage’ – to replace the growth superstar ALU.
As with most things, some have worked well – and some not so well. The real duds were associated with Webjet (WEB) and its subsequent spin-offs. He also dumped his small holding of Megaport (MP1) – but, he is now having a rethink about MP1. As the Slack Portfolio is fully invested at the moment, to buy something, he must first sell something.
BetaShares Diversified All Growth ETF (DHHF)
This was the last thing that Slack Investor bought on his 2024 buying spree and, to be honest, he didn’t look to0 deeply into it. Slack Investor was initially impressed by the simplicity of an All Growth ETF at a low management fee (0.19%). DHHF has done very well since purchase (+11%). The ETF is certainly diversified but, he is wondering whether the All Growth, as it says on the label, means that it is growing.
DHHF is a bundle of four low cost funds. The funds are:
The percentage allocation, on 24/01/2024, with the Management Expense Ratio (MER) of the underlying funds is shown below. Betashares have done a good job to ensure the underlying funds have very low fees (MER).
ETF
% Allocation
MER (%)
VTI
42.0
0.03
A200
37.1
0.04
SPDW
15.0
0.03
SPEM
5.7
0.07
Slack Investor must admit to a misunderstanding when he bought DHHF – he thought All Growth meant he was buying a selection of growing companies. It is only when he read the accompanying Product Disclosure Statement that he realised that All Growth was in reference to the fund being almost 100% in growth assets (shares or property). They are using All Growth as a descriptor to investing style. The All Growth assets make this fund suitable for those who have a high tolerance for risk. Betashares recommend a holding period of at least 7 years.
Does Growth mean Growing?
Not necessarily. This can be confusing – it was for Slack Investor! He has been guilty of using these terms interchangeably. Growth can be used as an investment style description – indicating the asset mix and amount of risk. The more shares and property in the mix, the higher the risk (chance of negative returns). According to Investsmart, typical mixes for funds are:
High Growth: around 100% in shares or property.
Growth: around 85% in shares or property, and 15% in fixed interest or cash.
Balanced: around 70% in shares or property, and 30% in fixed interest and cash.
Conservative: around 30% in shares and property, and 70% in fixed interest and cash.
Cash: 100% in bank deposits or ‘capital guaranteed’ products.
Of course, Slack Investor should have fully read the DHHF PDS before his purchase – a rookie error! Because he also has a stable income portfolio, the ‘riskiness’ of DHHF didn’t bother Slack Investor. However, his favourite companies to fill the Slack Portfolio are those that are having earnings that are actually growing or, are projected to grow, at least 10%.
A big portion of DHHF consists of the ASX 200 (37.1%). Slack Investor owns a small holding of the Australian Index and, he acknowledges that it is a fantastic part of any income portfolio – as it is a great source of dividend imputation income. However, he has never really been a big fan of the ASX 200 in the growth-based (or, should I say, growing-based) Slack Portfolio.
The ASX 200 is a mixture of ‘Duds’ (shrinking companies, decreasing earnings), mature companies (companies in steady state – earning but not really growing) and, companies that are increasing earnings and actually growing.
In the ASX 200, seven of the top ten holdings are either banks or mining companies – these types of companies are not known for growing every year at above 10%. For example, the top ASX 200 holding is the Commonwealth Bank (CBA). According to the Market Screener site, CBA’s 2024 Earnings Per Share (EPS) growth was -4%. For 2025 and 2026, growth is projected to be 5% and then 4% p.a.
Slack Investor rates Betashares DHHF to be an excellent ETF for diversified share exposure at a relatively cheap cost. It definitely qualifies as High Growth as it consists of nearly 100% in shares or property. However, Slack Investor would rather concentrate on companies that are actuallygrowing. He will sell DHHF and use the cash to buy something else.
January 2025 – End of month update
Slack Investor is IN for Australian index shares, the US Index S&P 500 and the FTSE 100.
The new year has started well, particularly for the UK and Australia where, the FTSE 100 is up 6.1 %, and the ASX 200 up 4.6% in January.
The S&P 500 (+2.7%) is relatively subdued after the monster 25% gains of 2024.
All Index pages and charts have been updated to reflect the monthly changes – (ASX Index, UK Index, US Index).
A few times a year, Slack Investor likes to take a snapshot of the markets using the Cyclically Adjusted Price to Earnings ratios (CAPE) – which use ten-year average inflation-adjusted earnings. He first started using CAPE as a ‘value’ tool in September 2021 and, the most recent post on Market Value was for the end of May 2024. That was 6 months ago and, probably due to the strange ‘Donald 2.0’ effect, the US and Australian markets have powered on since then.
Shiller P/E and S&P 500 10-year annualised forward returns from 1983. There is a clear relationship between higher CAPE and lower expected 10-yr returns for the S&P 500. Data valid as of 31 December 2023 – Investco
The CAPE (cyclically adjusted PE) ratio is not a useful timing signal for market turning points, but is a powerful predictor of long-term market returns.
For the following charts, Slack Investor uses monthly CAPE data from Barclays, the 40-yr mean is calculated and plotted together with the latest CAPE values – up till the end of November 2024. A ‘fair value’ zone is created in green where the CAPE is within one standard deviation of the mean (average) – click images for better resolution.
ASX 200 CAPE Value 23.0 (12% above long-term av.)
ASX CAPE values – up till the end of November 2024
FTSE 100 CAPE Value 16.3 (7% below long-term av.)
UK CAPE values – up till the end of November 2024
S&P 500 CAPE Value 37.7 (52% above long-term av.)
US CAPE values – up till the end of November 2024
What is Slack Investor doing about the high US market values?
The CAPE ratio is a helpful way for Slack Investor to look at the current state of the markets – it doesn’t change his approach to investing. He will just stick to his guns with his tried and true investment strategy.
Invest in a range of companies using ETF’s or a portfolio of at least 15 stocks.
For the individual stocks, continually monitor these investments to make sure that they still have some competitive advantages (e.g. A Moat), generate sustainable profits, they are continuing to grow and predicted to grow further.
These type of companies should do OK over most market cycles.
Slack Greetings from the UK – an ode to English Pubs
Slack Investor is not really much of a cold season traveller but he is here in the UK for some family business. England in winter is pretty grim with short days and cold weather. However, there is joy in slipping into a great English pub with a fire going and conversation everywhere. Experience tells me that most English pubs are good. But, he wasn’t just in any pub – Slack Investor was drinking at the RAF bar of The Eagle in Cambridge. Famous for being the pub where Francis Crick and James Watson (based on the work of Rosalind Franklin and others) celebrated and announced the double helix structure of DNA in 1953. Long live the English Pub.
The Eagle, Cambridge, UK. Long live the English Pub.
Slack Investor has never seen the film, though well reviewed, but he did struggle through the complex book by John Irving in the late eighties. His interest in GARP has been rekindled by a new ‘Smart Beta’ ETF that has been floated by Global X in October 2024. This one is fresh!
Smart Beta refers to an enhanced indexing strategy that seeks to exploit certain performance factors in an attempt to outperform a benchmark index – Fidelity
This is good … is it possible to get the benefits of passive investing with some of the advantages of active investing strategies? Can you have low fees with better performance than benchmarks? Perhaps all the hard work in selecting growth stocks can be done with a financial selection algorithm and Slack Investor can get back to the couch.
Growth at A Reasonable Price (GARP) … in an ETF … am I dreaming? Is this too good to be true? Ahh … there is a management fee. But, it’s 0.3%. Not bad for a fund that has some selection smarts plus international exposure. There is a lot to like about this ETF.
Selection Process for GARP ETF
The GARP ETF tracks the S&P WORLD EX-AUSTRALIA GARP INDEX using a rules based stock section process. From the global shares universe, all companies are assigned a Growthscore for their previous 3-yr growth. Then there is a Quality score that combines company assetsto debt ratio, return on equity (ROE), and the earnings to price ratio (Inverse of P/E Ratio).
Once the ranking is complete, shares are selected that score highly in both categories and some restrictions on exposure to individual shares and sectors is applied – Mark LaMonica, Morningstar
So, by weeding out some of the companies that are ‘unreasonably’ priced the top 250 global companies are selected according to GARP principles. The price (P/E Ratio) filter should help mitigate the portfolio downside in a market downturn.
Performance
The GARP ASX ETF has only been running a month but Morningstar has gathered some data based upon the GARP principles over time.
GARP seems to perform better than the S&P 500 in some time frames, particularly in the periods that include a share crash. The 5-yr period includes the 2020 ‘Covid Crash’ and, the 20-yr frame includes the 2007–2008 financial crisis (GFC). But these are just index values – without fees. When you factor in the GARP management fee of 0.3% compared to the iShares S&P 500 ETF (IVV.ASX) fees of 0.04%, the outperformance of GARP does not look as good.
There are a lot of tech companies in here but also some consumer discretionary stocks. Some of the more expensive (high P/E ratios) tech companies must have been filtered out by the GARP process. It is only when Slack Investor takes a closer look at these companies that he starts to get ‘cold feet’. Overall, Slack Investor thinks this is a good package to get exposure to reasonably priced growth companies. Two things that hinder Slack Investor from investing are :
In the the top 15 holdings, there are 3 Petrochemical companies – Exxon, Chevron and Shell.
Slack Investor will admit to some hypocrisy here. He owns a 15-yr old petrol driven car and regularly uses jet fuel to get to far away places. On the plus side, his roof is making renewable energy. However, the world is getting hotter and he’s aware that we must continue to work toward phasing out the use of fossil fuels. Are you listening Donald?
Slack Investor is a part owner of all types of companies through index and broad market ETF’s (e.g. VGS, STW, S&P 500 Index, etc). However, he has a ‘piddly’ moral stance of trying not to bundle into the Slack Portfolio any ETF’s that activelyselect higher proportions of Tobacco, Gambling or Fossil Fuel companies.
Is this making a better world? Probably not. But, leave Slack Investor alone to pursue his token activism – no harm done. Besides, it’s likely to be better than doing nothing. This is a personal thing and, Slack Investor encourages all investors to take on any sort of investment stance that feels right for them – providing it is profitable in the long term.
Slack Investor tries to be a little diversified in his investing with his Three Pile Theory. Although my Investment Pile (The Slack Fund) consists mostly of Australian and International Shares, my Stable Pile (about 30% of retirement funds) consists of annuities, Real Estate ETFs, Fixed Interest products, some high dividend paying shares and some Cash. I own no bonds, Gold or Cryptocurrency. I am not very strict about rebalancing … but, that’s because I am slack! Deep down however, I’m convinced that diversification makes good financial sense.
A quick look at the yearly Vanguard diversification table below shows the percentage annual total returns for 9 different asset classes. I have only shown the last 17 years, but the 30-yr table can be found here in .pdf form.
For financial year 2024, the best performers were: Australian listed property returned 24.6%, US shares 24.1% and hedged ($AU) International shares 21.5%. The point of the Vanguard table is to highlight that it is very hard to try and predict the yearly winner. Slack Investor notes that International shares (particularly the US) have featured in the top 3 for a lot of these last 17 years. He also notes that Cash is a rare top performer – but, well done for 2022! It is always useful to have a look at the Vanguard Long Term Investing chart for a reminder of the compounding power of share investing.
Auto-Diversification
Superannuation
All of your Super contributions end up in a fund that is diversified to some extent. You usually can decide on how diversified you want it to be. For example, Australian Super offers, in their pre-mixed options: High Growth, Balanced, Socially Aware, Indexed Diversified, Conservative Balanced and Stable offerings. Even their High Growth option is split into a number of different asset classes – though their ranges seem a little ‘loose’ for full disclosure to their clients.
Slack Investor’s instincts has always been to be invested with the highest growth option … though I did reassess this a few years before retirement!
Other Investments
OK then, super is taken care of … but what if you want a diversified option for other investments that could be assured long-term growth without constant input. This is where robo advice might shine. Robo advisors usually package a mixture of low cost ETF’s into a diversified portfolio with automatic re-balancing.
Slack Investor is aware of many robo advisers that operate in Australia. ValueWalk has prepared an excellent summary article. Valuewalk compares and reviews: CommSec Pocket, Spaceship Voyager, Betashares Direct, Raiz, Sharesies, Pearler, Stockspot and InvestSMART.
There is a sliding scale management fee for which all admin and rebalancing is taken care of. For example, for account balances of $200,000+, there is an annual fee of 0.528% per year.
When Slack Investor loses the ability to stock pick growth stocks effectively (or, perish the thought … shuffles off this mortal coil!), I will set up some succession plans that will move our investments onto a secure ‘minimal involvement’ platform such as robo advice.
Slack Investor is old fashioned when it comes to ETF ownership. I much prefer the robo advisers that run under the HIN system (Holder Identification Number) – where the ETF’s are registered in your own name. This makes things simple if the robo adviser should cease operations e.g. Six Park (Aust).
The alternative is the ‘custodial’ system – where the investments are held on your behalf. Although custodial models can have lower costs – I like to see my name on the ownership documents. Stockspot is one of the advisers that run under the HIN system.
Although Slack Investor is a great believer in finding out about financial things for yourself with the magic of the internet. This way is not for everyone. Let’s just be clear, for most people, if you want specific advice on wealth management, tax advice, estate planning or a multitude of other finance problems, you are best counselled to seek a qualified financial adviser.
However, if you have a lump of money that you want invested in a diversified way that suits your risk profile, then robo advice seem a relatively cost-efficient way to ensure your investments are spread across asset classes. Naturally, Slack Investor would like the fees charged by robo advisors to come down a little before he parts with his Slack funds.
September 2024 – End of Month Update
Another month with a big range of daily closing values. The ASX 200 (+2.2%) and the S&P 500 (+2.0%) are in all time high territory. The FTSE 100 languishing and down 1.7% for the month.
Slack Investor remains IN for all markets.
The recent strength of the US market has pushed the closing monthly value to more than 15% above my old stop loss. I adjusted the stop loss upwards to a new ‘higher low’ of 5119.
Weekly chart for the S&P 500 Index showing the stop loss revised upwards to the new “higher low” of 5119.
All Index pages and charts have been updated to reflect the monthly changes – (ASX Index, UK Index, US Index).
The quarterly updates showing the shares in the Slack Portfolio have also been completed.
Slack Investor does not provide specific advice, but occasionally he will expand on the way he invests and report on the things that he is looking at. I will sometimes mention actual stocks or financial products that I am interested in.
I don’t regard myself as a gun “stock picker”- my long-term success rate for “winning” stocks is about 55% for completed trades over a 20-yr period. What I think I am OK at though, is weeding out the dud trades and sticking with the winners. My overall results are good. I find that if you surround yourself with solid growing companies – more good things will happen than bad things.
I think a couple of follow up posts are in order to pass judgement on some of the good, and bad, ideas that Slack Investor has thrown out into the world.
Slack investor had a bit of loose change and was “on the buy”. I outlined my case for Alphabet (GOOGL.NASDAQ), the Betashares NASDAQ 100 ETF (NDQ.ASX), and the Coles Group (COL.ASX).
Slack Investor was looking at technology changes in the music Industry using one of the more interesting charts that he has found. Who knew that “Peak Revenues”, from cassettes was in 1980, from CD sales in 1999, and peak music downloads in 2005. The only music revenue games in town now, are streaming, and live performances.
This was a roundabout way of showing the profound effect and fast moving pace of technology. I suggested a good way to capture this technology tidal wave was Betashares NASDAQ ETF(ASX: NDQ). The share price at publishing time was $32.47, at 30/06/2024 it is $45.51, up 40.1%. Well done Slack Investor– 8/10
The human trait of innovation was explored and this was also seen to be a great attribute for companies that I would like to invest in. A simple way to expose yourself to innovation on the Australian market was through ETF’s. Betashares NASDAQ ETF(ASX: NDQ), BetaShares Asia Technology Tigers ETF (ASX: ASIA) and the ETFS Morningstar Global Technology ETF(ASX: TECH) were thought to be a way to do this.
ETF
Price 30/06/23
Price 30/06/24
% Growth
NDQ
$35.25
$45.51
+29.1%
ASIA
$9.29
$9.21
-0.6%
TECH
$101.90
$95.9
-5.8%
Average Growth
+7.6%
Some “Innovation” ETF’s
With the exception of NDQ, not so good here and it is another internal warning to avoid the over-curated themed ETF”s. I am sill investing in NDQ, but I sold out of ASIA after 9 months as China was adding some “government risk” to their stock market. Fortunately, I didn’t get around to investing in TECH. An inconsistent effort, Slack Investor seems easily distracted – 5/10
One of the Slack favourites, CSL, asked shareholders to stump up some money in a Share Purchase Plan. The asking price was $273 – which I thought was OK for such a great, growing company. The share price at 30/06/24, is $295.21, up 8.1%. A solid performance, Slack Investor, but not shooting the lights out – 6/10
I liked the look of Dicker Data (DDR) after a slump in its share price. At the the publishing date, DDR was trading at $10.44. At 30/06/24, it is $9.66, down 7.5%. Since November 2022, there has been a downgrade in profits and the CEO has sold 10% of his shares. The forecast numbers still look OK, but so far disappointing. DDR is on shaky ground – and could get the chop! Needs Improvement, Slack Investor – 2/10
Slack Investor had a “bit of a go” at famous US investor Cathie Wood and her ARK Innovation ETF (NASDAQ: ARKK). My case was, that their was a lot of talk … and not much performance from her $6 billion USD actively managed fund. The price chart has continued to languish, and her 5-yr performance figures have got worse – and well behind the performance of the passive S&P 500 and NASDAQ 100 ETF’s. The 5-yr trailing annual return for ARKK is currently -1.6%. Compared to the NASDAQ 100 (20.5%) and the S&P 500 (15.0%). It seems as if Ms Wood’s Mojo has deserted her for now. Cathie Wood – 1/10; Passive US Funds – 9/10
The financial year closes and the Australian, UK and US markets are all in positive territory.
Slack Investor remains IN for all followed markets. The ASX 200 (+0.9%) and FTSE 100 (-1.3%) didn’t move much for the month. It is a continuation of good times in the US with the S&P 500 rising 4.6%. There has been a big gain in the US market this financial year of 22.7%. On top of an increase of 16.4% last financial year, Slack Investor is getting a little nervous about the US – especially after the debate last week!.
All Index pages and charts have been updated to reflect the monthly changes – (ASX Index, UK Index, US Index). The quarterly updates to the Slack Portfolio have also been completed.
A few times a year, Slack Investor likes to take a snapshot of the markets using the Cyclically Adjusted Price to Earnings ratios (CAPE) which use ten-year average inflation-adjusted earnings. I first started using CAPE as a “value” tool in September 2021 and, my most recent look was for the end of January 2024. I have decided to do this CAPE market value analysis every few months.
Jeremy Grantham is a well known and astute investor and he argues that recent globalization has benefited the profitability of US companies and that their is good reason for an increasing CAPE trend in the US markets. However, there is some good research that links CAPE to future returns.
The CAPE (cyclically adjusted PE) ratio is not a useful timing signal for market turning points, but is a powerful predictor of long-term market returns
By plotting this CAPE over a period of time, we can look at how the whole sharemarket is currently valued in terms of historical data – this way we can track the whole share market as it oscillates between overvalued and undervalued. According to Research Affiliates, CAPE offers a negative correlation with subsequent 10-year and 20-year stock market returns – the higher the current CAPE, the lower are the expected future returns.
For the following charts, I use monthly CAPE data from Barclays, the 40-yr mean is calculated and plotted together with the latest CAPE values – up till the end of May 2024. A “fair value” zone is created in green where the CAPE is within one standard deviation of the mean (average) – click images for better resolution.
The US market remains the outlier here at 37% above its long-term value. Slack Investor is no guru, but, it doesn’t make sense to him to invest new money into a “frothy” whole-market index like the S&P 500 – at the moment!
ASX 200 Value (4% above long-term value)
FTSE 100 Value (4% below long-term value)
S&P 500 Value (37% above long-term value)
Slack Greetings from Provence – plus Navigational Tips
Evening view of the Luberon Valley, from Bonnieux, Provence. France
Slack Investor is in Europe at the moment (Boo … Hiss!), I have just finished a walking holiday in Provence, France. All I can say is that – it is a beautiful part of the world.
Steeped in history and preserved in that remarkable French way that respects the past. We moved around the intricate roads and paths using a fantastic bit of Android/IOS/Windows software called Komoot. The software is free to download on your phone with one local region – and, I added world maps for a one-time lifetime fee of $30 USD about 10 years ago – It was the best money I have ever spent, as I use the app daily. You can plot “tours” that are based upon the comprehensive “Open Street Maps” network which lists all the tiny paths and tracks that rarely appear in Google Maps. The output is best used on your phone – but the app is easier to plan using the desktop version of your Komoot account. I have no financial interest in any of the products that Slack Investor sometimes rambles on about.
Google Maps output for the area 5km east of Gordes, Provence, France – great for roads and business locationsKomoot output for the area 5km east of Gordes, Provence, France – Great for smaller roads and footpaths (tracks). The footpaths are shown as black lines and the blue line is our journey out from Gordes on the way to Roussillon.
Sundar Pichai, the CEO of Google and its parent company Alphabet looks ready to play the “evil genius”.
At around 15% of my investments, Alphabet (US:GOOGL) is a major holding in my portfolio. It is my biggest international holding. I first dipped into the stock back in 2019 and have been trying to top up (in small amounts) each year since.
Since Larry Page and Sergey Brin launched Google in 2004 with a killer search engine, the many tentacles of Google/Alphabet have spread into the everyday life of billions. Youtube alone had 2.6 bn annual users in 2022.
(Google’s search and advertising) is Alphabet’s best business, accounting for 80% of Google’s total revenue in 2022 including Google Search and other properties like Google Network ads and YouTube. The remaining 20% comes from Google Cloud (9.4%) and its apps, hardware and content businesses (10.4%).
When the income chart looks like the above showing a track record of growth (prior to 2023) – and projected further growth up to 2025 – I’m interested. A look now at Slack Investors favourite finance indicators. A projected Return on Assets (ROE) of 24.5 in 2025 (well above 15%), a 2025 predicted PE ratio of 17.5 (very low for a growth stock), and plenty of cash on hand for further aquisitions – it all looks good.
Nitpicking
Despite admiring the skill of Alphabet management in aquisition and company growth, Slack Investor is notenamoured with everything this company does. There are some things that I find annoying. Back in 2017, they sudddenly dropped their popular Google Finance Portfolio feature. Slack Investor then migrated to Yahoo Finance to keep track of his portfolio. I note that Google Finance has recently reinstated its porfolio feature – but I have already moved.
To keep growing revenue, many of their channels are being further monetized. I love using Youtube for music, entertainment, and the millions of helpful “how to” guides. However, the ads at the start of the clips are tedious. This is an attempt to get people into Youtube (no ad) Premium at $13.99 per month.
I also had a recent battle to reduce the amount of data in my google account (Photos, Google Drive, gmail) to below the 15 Gb free limit. This is deliberatly not a simple process and seems to be designed to push people into more storage through a subscription starting at $2.49 per month.
These are relatively small quibbles though – and Slack Investor really doesn’t expect “something for nothing”. I continue to hold and a happy buyer of this company using an international e-broking account with CMC Markets – Alphabet, I hope, will be a very long-term holding.
A bloke with a barrow of mutilated currency circa 1910
Every quarter, the economic boffins at ASFA (Association of Superannuation Funds of Australia go to the trouble of crunching the numbers on what yearly income they think is required for a “comfortable retirement”. They assume that the retirees own their own home outright and are relatively healthy. In one year, due to inflation, the comfortable retirement amount has increased by 7.6% , or $4920, to $69,691 for a couple (Dec 2022 ).
Comfortable lifestyle (p. a.)
Modest lifestyle (p. a.)
Couple $69,691
Couple $45,106
Single $49,462
Single $31,323
ASFA calculated annual retirement requirements for those aged 65-84 (December quarter 2022) for both “comfortable” and “modest” lifestyles
ASFA’s calculations are very detailed, but notably these annual incomes do not include any overseas travel – depending on your accommodation standards and length of journey, this could easily require another $20K.
Their latest December 2022 report notes that price rises have occurred for most spending categories. In the last four quarters,
Food rose by 9.2%
Bread 13.4%
Meat and seafoods 8.2%
Milk 17.9%
Oils and fats 20.8%
Gas 17.4%
Electricity 11.7%
Household appliances 10.2%
Automotive fuel 13.2%
Domestic travel and accommodation 19.8%
International travel and accommodation 15.9%
ASFA also helpfully calculate a lump sum that you will need to supply this income – with the assumptions that the lump sum is invested (earning more than the cpi) and will be fully spent by age 92. Let’s aim high and just concentrate on the comfortable retirement – the “modest” retirement lump sum amounts are much lower (around $100K) as they assume supplementation from the aged pension.
Savings required for a comfortable retirement at age 67
Couple $690,000
Single $595,000
ASFA calculated lump sum t requirements for those aged 65-84 (December quarter 2022) for a “comfortable” lifestyle
How to Cope with Inflation
There is just one simple way – you must be invested in appreciating assets that keep pace (or exceed inflation). Appreciating assets tend to go up in value over time. This is pretty vague, but if you are unsure about an asset, try and find a price chart over a 10-yr to 20-yr period. If it is going up, it is probably an appreciating asset.
You will always need some amount in cash for day to day requirements and to ride out any investment cycles without the need to cash in your investments at a low point in the cycle.
Knowing the difference between an appreciating and a depreciating asset (e,g cars, furniture, technology equipment, boats, etc) was an important step in Slack Investor’s investing life. I can still remember the day my father gave me “the talk”, that it was OK to borrow money for appreciating assets – I think he was pushing me in the direction of real estate at the time. However, I was not to borrow for a depreciation one i.e. a car, or consumer goods – assets that lose value when you walk out of the shop!
Appreciating Assets
Below is a (not exhaustive) list of appreciating assets. I have left out cryptocurrency deliberately as it has only been traded since 2010, and it is not established yet that it is a long-term appreciating asset.
List of appreciating assets:
Real estate
Real estate investment trust (REIT)
Stocks (Shares) and ETF’s
Bonds
Commodities and Precious Metals
Private Equity
Term Deposits and Savings Accounts
Collectibles e.g. Art
Term deposits and savings accounts might keep pace with inflation (if your lucky!) – but generally do not grow faster than inflation. Slack investor will write about why owning your own home and investing in Stocks (Shares) and ETF’s are his favourite appreciating assets in a later post.
“The sole difference between myself and a madman … is the fact that I am not mad!”
Salvador Dali
Persistence : (Noun) the act of persisting or persevering; continuing or repeating behaviour – vocabulary.com
Persistency is a great investing quality that impresses Slack Investor – but I acknowledge the difficulty. Standard & Poor’s collect data from the US market on how consistently recent top performing share funds are able to keep producing winning records in subsequent years. The following graphic tracks the funds that were in the top 25% of performers in 2018 – and who stayed in the top quartile in successive years.
The percentage of US funds that remain in the top 25% of funds after a 1, 2, 3 and 4 year period – S&P Research – Not many! – Ifa.com
Over a five-year horizon “it was statistically near impossible to find consistent outperformance.”
Just because a fund, or portfolio, did well in one year does not mean it will continue to perform well the next year. Slack Investor has found this himself with his best performing stocks often becoming the worst performing in the next year – such is the nature of stocks. The stock market often moves between being overvalued and undervalued – and it is the same for individual companies.
Most active (stock picking) funds do not exceed their long-term benchmarks
Not only do active managed funds struggle to maintain consistency, most of them underperform index funds. We are lucky that there are a group of economic boffins that keep an eye on things in the funds department. They are the known as SPIVA (S&P Indices Versus Active). Since 2002, they have been collecting world financial data and comparing actively managed funds to passive (Index) Funds. The 2022 data is now in and the disappointing theme continues. For Australian Equity (Share) funds, for the 5 and 10-yr horizons, respectively, 81.2% and 78.2% of funds underperformed the S&P/ASX 200.
The percentage of underperforming Australian funds in various categories over a 1-yr, 3-yr, 5-yr, 10-yr and 15-yr period – SPIVA 2022 Report
How to cope with inflation
To keep pace with inflation you must be invested somewhere – so that your investments can grow faster than inflation (cpi) over time (at least 5 years). I will explain in a future article why I prefer shares and ETF’s as the vehicle to do this over other appreciating assets. So, on this path, to be exposed to equities (or stocks) you can either buy
Active managed funds – Roll the dice here as most of these underperform Index funds after fees, but the minority showed some skill over benchmarks over a 5-yr period – but there is no guarantee that they will keep ahead of their benchmarks.
Low-Cost Index Exchange Traded Funds (ETF’s) – this is the easiest path, and Stockspot have made the process even simpler by researching the best Index ETF’s in each class.
Exchange Traded Index Funds (ETF’s) for a Portfolio
Stockspot diligently analysed 640 of the largest managed funds available in Australia.
Australian Shares Index ETF
For Australian share exposure, Stockspot recommends the ETF ASX:VAS – as it has outperformed 74.3% of large cap Australian shares managed funds over 5 years with an Indirect Cost Ratio (Management Fee) of 0.1% and an annual return (over 5 years) 0f 9.0%.
Here, Stockspot recommends the ETF ASX: VSO– as it has outperformed 63.5% of small cap Australian shares managed fundsover 5 years with an Indirect Cost Ratio (Management Fee) of 0.3% and an annual return (over 5 years) 0f 11.7%
For a swing at the world markets, Stockspot recommends the ETF ASX: IOO – as it has outperformed 97.5% of the large cap global managed funds, available in Australia, over 5 years with an Indirect Cost Ratio (Management Fee) of 0.4% and an annual return (over 5 years) 0f 14.2%.
After a sparkling January, the calendar year has crawled along in share market gains. But, it’s “dividend season” now – and this cheers Slack Investor up greatly.
Declines this month for the Australian and UK markets (ASX 200 – 1.1%, FTSE 100 -3.1%). Those irrepressible optimists in the US keep powering on, with the S&P 500 up 3.5% – even though this is the most overvalued of Slack-followed markets.
Slack Investor remains IN for the FTSE 100, the ASX 200, and the US Index S&P 500.
All Index pages and charts have been updated to reflect the monthly changes – (ASX Index, UK Index, US Index). The quarterly updates to the Slack Portfolio have also been completed


