

Slack Investor is enjoying the relative calm in the markets over these past couple of days. It is a good time to update the charts for the Cyclically Adjusted Price to Earnings ratios (CAPE). He first started using CAPE as a ‘value’ tool in September 2021 and, the most recent post on Market Value was for the end of December 2024. That feels like such a long time ago – pre-Donald 2.0. The markets have been on quite a ride since then.
There is some good research that links CAPE to long-term returns … and future returns are what gets Slack Investor excited. The predictive skill of the Schiller CAPE is not very good over 1-yr and 5-yr periods. However, it does show some skill for periods of 10 years and longer.

Research Affiliates
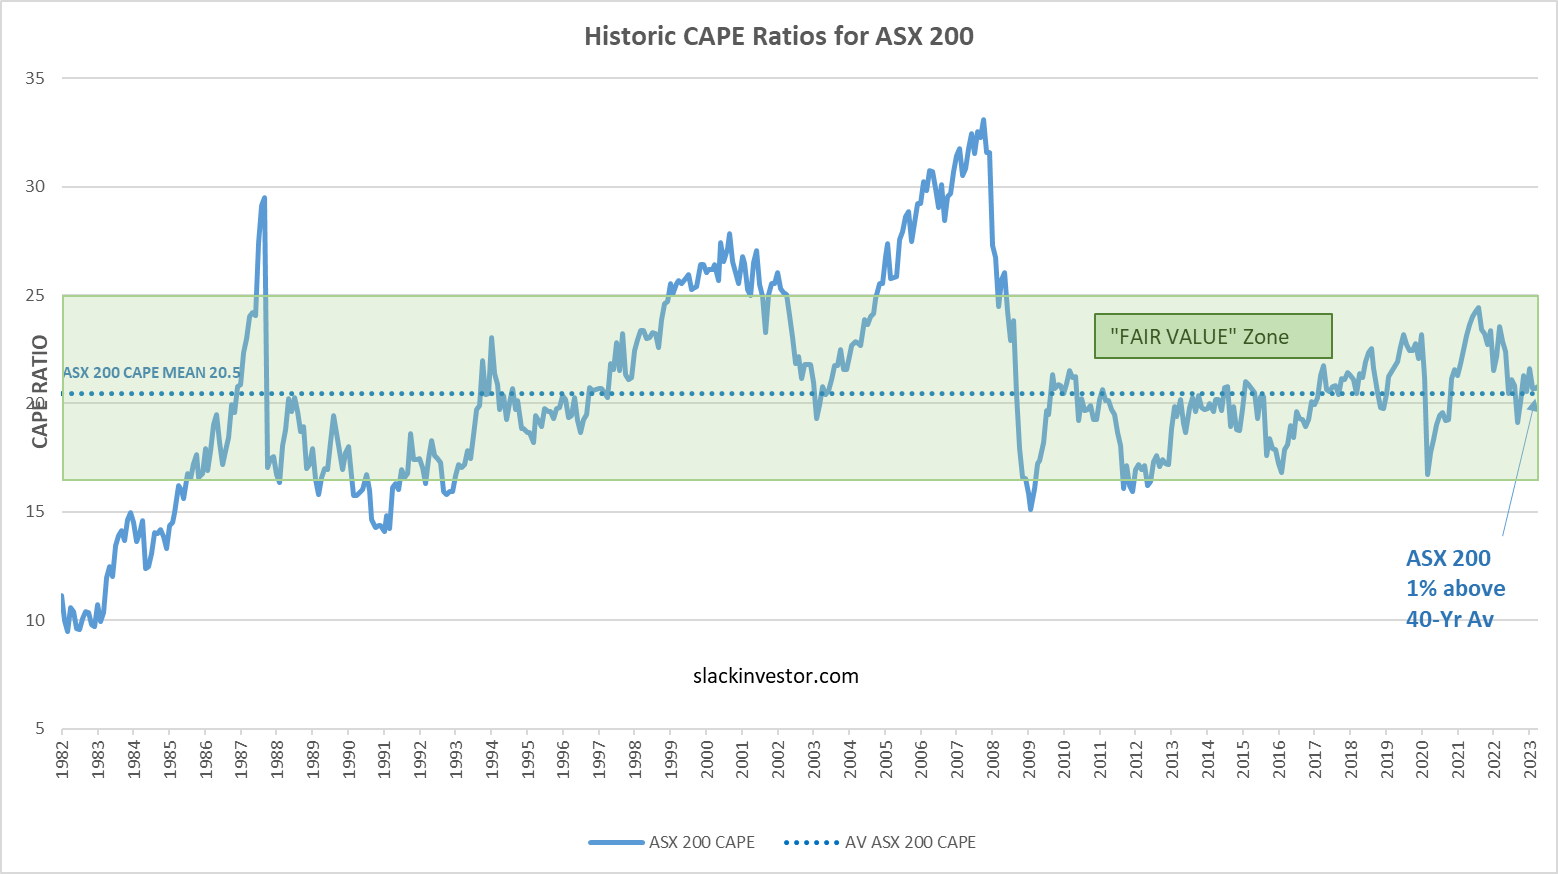
For the following charts, Slack Investor uses monthly CAPE data from Barclays, the 40-yr mean is calculated and plotted together with the latest CAPE values – estimated up until 14 April 2025. A ‘fair value’ zone is created in green where the CAPE is within one standard deviation of the mean (average) – click images for better resolution.
ASX 200 CAPE Value – 3% above long-term av.

FTSE 100 CAPE Value – 10% below long-term av.

S&P 500 CAPE Value – 32% above long-term av.

Market value and Market Timing Experiment

The ASX 200 and the FTSE 100 are both within 10% of their 40-yr CAPE average. When within the green ‘fair value’ range, Slack Investor has patience and he will be assessing these charts at the end of the month.
The US index chart was, and still is, above the ‘fair value’ range and Slack investor had the S&P 500 on a weekly check. Last week it plunged below the stop loss and Slack Investor sold. These are early days in the Trump 2.0 experience – given current form, there will be more surprises.
The US Index is just a small part of the Slack Portfolio (1.6%). The bulk of his portfolio is currently riding the market roller coaster – patiently in search of long-term returns.


