Slack Investor at age 18 near Albany W.A. – Before and After the GIMP treatment
Slack Investor likes to have a rounded life that is full of things that are not finance related. Occasionally, I will write a blog about something that I think is useful that I think that other people can also benefit from.
1975
49 years ago … Cripes! I had just finished High School and a mate and I went of on a Summer car surfing adventure from Melbourne to Western Australia before Uni started. As it turns out, 1975 would have been a good year to start investing … but life is much more rich and exciting than just investing.
Dusting of my old Photo Albums revealed that my memories had deteriorated to the standard below. It must have been the state of the art of photo emulsions in the 70’s.
The first thing to do is to scan the album page with your colour scanner/printer. I wanted to capture as much as I could of the original photos and played around with resolutions on my A4 scanner – as I eventually wanted to throw out the original albums. The scanning resolution that worked best for me was at about 400 dpi. In my case, increasing the resolution did not help the clarity of my original images. The above scan worked out to be about 4 Mb. I labelled the scan “Year Taken”_”Album Name”_”Page #”
I then cropped each individual image by pasting the scanned image into Microsoft Paint – but any photo edit software will do this. I labelled the image “Year Taken”_”Album Name”_”Page #”_”Photo #”
Get the GIMP
Not to be confused with the gimp from Pulp Fiction . Warning: this link is not not for the feint-hearted – Quentin Tarantino can go in a few sick directions!
However, this GIMP is software that is a fantastic cross-platform image editor available for Linux, macOS and Windows. It is free software that can be downloaded here … I used version 2.10.36 … and it can perform miracles!
Open up GIMP and find your individual image, cropped from your photo album, to be transformed . Select File/Open – Then open up the Color/Levels Dialogue box
The magic happens here when you press the “All Channels/Auto Input Levels” Button inside the pop-up Levels Dialogue Box (Below).
A miracle has been performed with one click of a button – and you can save the new image in .jpg format by clicking File/Export as …
There are simple ways to clean up the image of any blemishes … but we have done enough for today. Will have another go at another non-finance instructional post later this year.
My last post on “Salary Sacrifice” got me thinking on the other things that I did to help myself on the journey towards financial independence. I have before stressed the importance of your savings rate as the primary tool in the box – and, more than anything, this is the number that will affect when you become financially independent.
This figure can be calculated a few ways, but for simplicity, let’s define it as your retirement savings as a percentage of your take-home pay (disposable income after taxes and deductions) – this can be calculated using fortnightly, monthly, or yearly data.You can work out your own savings rate or, if you are in a stable relationship with a combined goal, include your partner’s savings and take-home pay.
SAVINGS RATE (%) = 100 x (Total amount of Savings put aside for Retirement/Take-home Pay)
This savings rate is the percentage of your after tax income that you must be putting towards retirement – and it defines the number of years that you have to work until you can sustainably generate your expenses from your investments. There are some assumptions for the following chart:
This magical curve is presented below to bring a bit of clarity to your goal. The object is to get to the stage when your annual return on investments (Passive income) cover 100% of your expenses. This represents the beautiful state of financial independence.
From The Escape Artist – using the conservative assumption of a 5% return on your retirement portfolio after inflation.
In Australia, with compulsory superannuation, 10% of your gross salary is deducted from your wages. Taxation rates will vary, but lets just say that 10% of your gross salary is the equivalent of about 15% of your net salary (disposable income). You add your superannuation to any other retirement saving that you are doing to get your total amount of savings put aside for retirement.
Starting from scratch, from the above graph, if you worked continuously, and only relied on compulsory superannuation you enter the full-time work force and you are 42.8 years away from a retirement – where your living expenses are covered by the passive income from your retirement savings. In other words, if working continuously, a 22-year old starting full-time work will have enough passive income to cover expenses when reaching the age of 64.8 – relying solely on compulsory super.
In Australia, there is also the aged pension to kick things along after age 67. Obviously, if you want to retire sooner and have a bit extra for holidays, and to allow a bit of a safety margin, and be financially independent – You will have to do some extra savings towards retirement yourself.
How are people going with their savings rate?
For Australians, the compulsory superannuation system provides a sound base for retirement savings (with a working life of 42.8 years). This doesn’t factor in the government funded aged pension – subject to a means test. Currently the pension (September 2023) is $28,514 per year for a single person – But who knows if this will still be available at present levels in the future. It is best to plan for your future without it – and then accept it as a bonus if you qualify.
Although this sounds OK, any disruption to your working life (ill health, family, education, retrenchment, etc) will be a real setback to your retirement plans – Any work breaks will require additional savings for your retirement. In the US, the “average” savings rate was between 5-10% for many years. Despite some impressive savings rates during COVID-19, in July 2023, the personal saving rate in the United States amounted to 4.1 percent.
You would have to say … this does not bode well for a satisfying retirement for the “average” US Citizen.
What was the Slack Investor Savings Rate?
Rusted on followers of this blog will recall that I had a bit of a delayed start to thinking about retirement. I had just arrived back in Australia after a 6-year working holiday overseas. I was aged 30, broke, and the only thing I knew was that I didn’t want to continue working in the field that I was trained in – high school teaching.
Clearly Slack Investor had a bit of work to do. Once I was in regular employment again, I set about getting the financial building blocks in order. Emergency fund, house deposit … and then savings for my retirement. I did this mostly using salary sacrificing into superannuation and building up my own private share portfolio.
There is nothing Slack Investor likes more than burrowing into my financial history using the excellent and free “Sunset” international release of Microsoft Money. I use the Australian Version. I have been using this software to track my finances since 1990 (33 years!)
Including superannuation contributions, my savings rate for retirement fluctuated between 20% and 45%. From the top graph, this represents a shifting rate that was equivalent to an overall retirement goal that required between 36.7 years and 19 years of working. Since “ground zero” at aged 30 and some extra education, I ended up working mostly full time for 28 years. Luckily, I had found a job as meteorologist that I really enjoyed.
This is not the “hard core” road to financial independence (i.e retire at 35, etc) – but Slack Investor thinks a reasonable compromise with the competing priorities of raising a family and buying a house.
Savings Rate is so important. Determine what your own savings rate needs to be to achieve your retirement goals – and automate your savings deductions as much as possible – and get cracking!.
December 2023 – End of Month Update
Happy Days. The year closes and, Slack Investor was definitely not naughty … a big December “Santa Rally” this month. All followed markets rose. The ASX 200 up a mighty 7.1%, the FTSE 100 up 4.0%, and the S&P 500 up 4.4%,
Slack Investor remains IN for the FTSE 100, the ASX 200, and the US Index S&P 500.
All Index pages and charts have been updated to reflect the monthly changes – (ASX Index, UK Index, US Index). The quarterly updates to the Slack Portfolio have also been completed.
Slack Investor likes a bit of old art – and a picture that tells a story really floats my boat. But firstly, a bit of recognition to the fabulous Artvee site that gathers public domain files of artworks from around the world from galleries and museums.
This Jaques Sablet oil painting depicts a father returning home with a bandaged arm – where he reveals some loaves of bread to his hungry family. He has previously allowed a trainee surgeon to extract his blood in exchange for money.
Not suggesting a blood sacrifice is required these days for a loaf of bread – but a form of sacrifice that could help you on your journey to financial independence is Salary Sacrifice.
Salary Sacrifice
The key to tax-effective salary sacrifice is for the employee to take some of their remuneration in the form of concessionally taxed benefits instead of taking it all as fully assessable salary.
Australia has a progressive tax system that steps up at critical income values. The advantages of salary sacrifice are that you are buying a benefit in pre-tax dollars in an arrangement with your employer – who takes out the money before you see it. For example, if you sacrifice some of your pre-tax salary for superannuation contributions – instead of being taxed at your marginal rate, you are being taxed at the superannuation contributions rate of 15%. There is a tax saving.
Australian Residents Personal Tax Rates 2023-2024
Taxable income
Tax on this income
0 – $18,200
Nil
$18,201 – $45,000
19c for each $1 over $18,200
$45,001 – $120,000
$5,092 plus 32.5c for each $1 over $45,000
$120,001 – $180,000
$29,467 plus 37c for each $1 over $120,000
$180,001 and over
$51,667 plus 45c for each $1 over $180,000
The above rates are from the Australian Tax Office (ATO) and do not include the Medicare levy of 2%. There are defined things that you can “sacrifice” and pay for with pre-tax dollars. They include car expenses (loan, running costs and parking) and superannuation.
Salary Sacrifice For Superannuation
Slack Investor has always been a good saver and would save up and pay cash for a second-hand car rather than getting a car loan. The benefits of sacrificing salary for a car were small without the a car loan element. I did however see the advantages in sacrificing part of my salary for superannuation.
United Global Capital (UGC) provide the case study for worker William aged 45 who plans to retire in 20 years. He was given a pay rise of $5,000, bringing his total salary to $90,000 pa. Rather than pocket the gain, he uses the pay rise to boost his retirement savings and salary sacrifices the extra $5,000 salary into super each year
By using this strategy, he’ll sadly have less take home pay ($3275), but he will save on tax and have an extra $975 in the first year to invest into super, when compared to receiving the $5,000 as after-tax salary (see Table 1).
The real benefits are in the disciplined automatic saving of $5000 per year and the magic of compounding over 20 years. If he continued to salary sacrifice this amount into super, this could lead to William having an additional $228,500 in his super after 20 years (see Table 2).
There are drawbacks to salary sacrifice … the main one being that even though there is an overall benefit to your wealth position – it is not realised till you retire and start using your superannuation – this may be many years away. Your overall take-home pay will immediately reduce – which is a tough ask in these higher prices times.
Usually not much of a country and Western Fan, but Slack Investor is quite taken with this video of Slim Dusty in his rendition of Looking Forward Looking Back – where two Australian Music Legends (Don Walker and Slim Dusty) combine to make this beautiful Australian song. Slim must have been about 73 when this song was recorded in the year 2000.
Making sense of what I’ve seen All the love we’ve had between You and I, along the track Looking forward, looking back
This song is bitter-sweet to me as it was played at a good friend’s funeral … and I always get a little sad .. but then, I think of the good times I shared with my friend. My friend was also a keen investor and, I’m sure he wouldn’t mind me using this song to launch this post. It is a song of reflection … with a reminder to look forward as well.
Slack Five-Year Individual Share Performance
Though Slack Investor reports on his results on a yearly basis, the annual Nuggets and Stinkers post is a constant reminder of how, in successive years, a company can be “a nugget” … or “a stinker”. The market will often go in trends of overvaluation followed by a period of undervaluation – and the true measure of how the stock has performed is lost in these constant tidal changes. For my purposes (Slack!), a 5-yr measure of performance is about right – as this allows for the true performance of a quality stock to shine through.
I trawled through the Slack Portfolio to find stocks that I had owned for 5 years. I was suprised to find that, of my current 22 individual stocks or ETF’s that I own, I had held only 5 of these for 5 years. This is not what I expected from a Slack Investor and I had to drill down into the portfolio to realize that I had given my portfolio a big shake-up about 4-5 years ago. I had retired, injected a large portion of my work super into my SMSF, and also sold a few stocks to make way for a house purchase.
The 5 stocks that I had 5-yr data on were Altium, Macquarie Group. REA Group, CSL and Codan. The 5-yr Internal Rate of Return (IRR) figures give an “average” annual return for the 5-yr period and include dividends as well as any stock price growth. The results below, for the five years up to 30/06/23, are from my financial software – the free “Sunset” international version of Microsoft Money Australian Version. There are IRR calculators and Compound Annual Growth Rate (CAGR) calculators also available online. I have also included the CAGR Total Return (TR) till 30/06/23 for each of the Slack followed markets (in bold) for reference.
Stock
Symbol
5-yr IRR
Altium Ltd
ALU
14.8
Macquarie Group Ltd
MQG
12.7
S&P500 (TR)
12.2
REA Group Ltd
REA
11.3
CSL Ltd
CSL
8.4
ASX200 (TR)
6.3
FTSE100 (TR)
3.8
Codan Ltd
CDA
3.3
Digesting the above table, Slack Investor is generally pleased with the annual IRR over 5 years of the majority of held stocks. The exception is Codan (CDA) which has had a roller coaster ride in the price charts (see below) – and underperformed the ASX 200 index over 5 years. This stock needs further evaluation to see if I should continue to hold it in the Slack Portfolio.
There are strange days Full of change on the way But we’ll be fine, unlike some I’ll be leaning forward, to see what’s coming
I go to Market Screener Financials page for Codan to quickly see that the income for CDA is projected to increase for the next few years and the company is in a solid financial position. The projected Return on Equity (ROE) remains above 15% and, despite the dramatic price fall during 2021/2022 over earnings downgrades, the companies price trend so far in 2023, has been positive. This holding is currently on “watch” – but I remain a holder of CDA for now.
5-yr Price Chart of Codan (CDA) – from Investing.com
November 2023 – End of Month Update
Slack Investor is IN for Australian index shares, the US Index S&P 500 and the FTSE 100.
Due to a strong rebound this month Slack investor has cancelled his SELL Alert for the ASX200 that started at October 31 2023 due to a stop loss breach – and he now remains IN .
All Slack Investor overseas followed markets had a bumper month. The S&P 500 led the way with a massive rise of +8.9 %. More modest rises for the FTSE 100 +1.6% and the Australian stock market – the ASX 200 +4.5%.
All Index pages and charts have been updated to reflect the monthly changes – (ASX Index, UK Index, US Index).
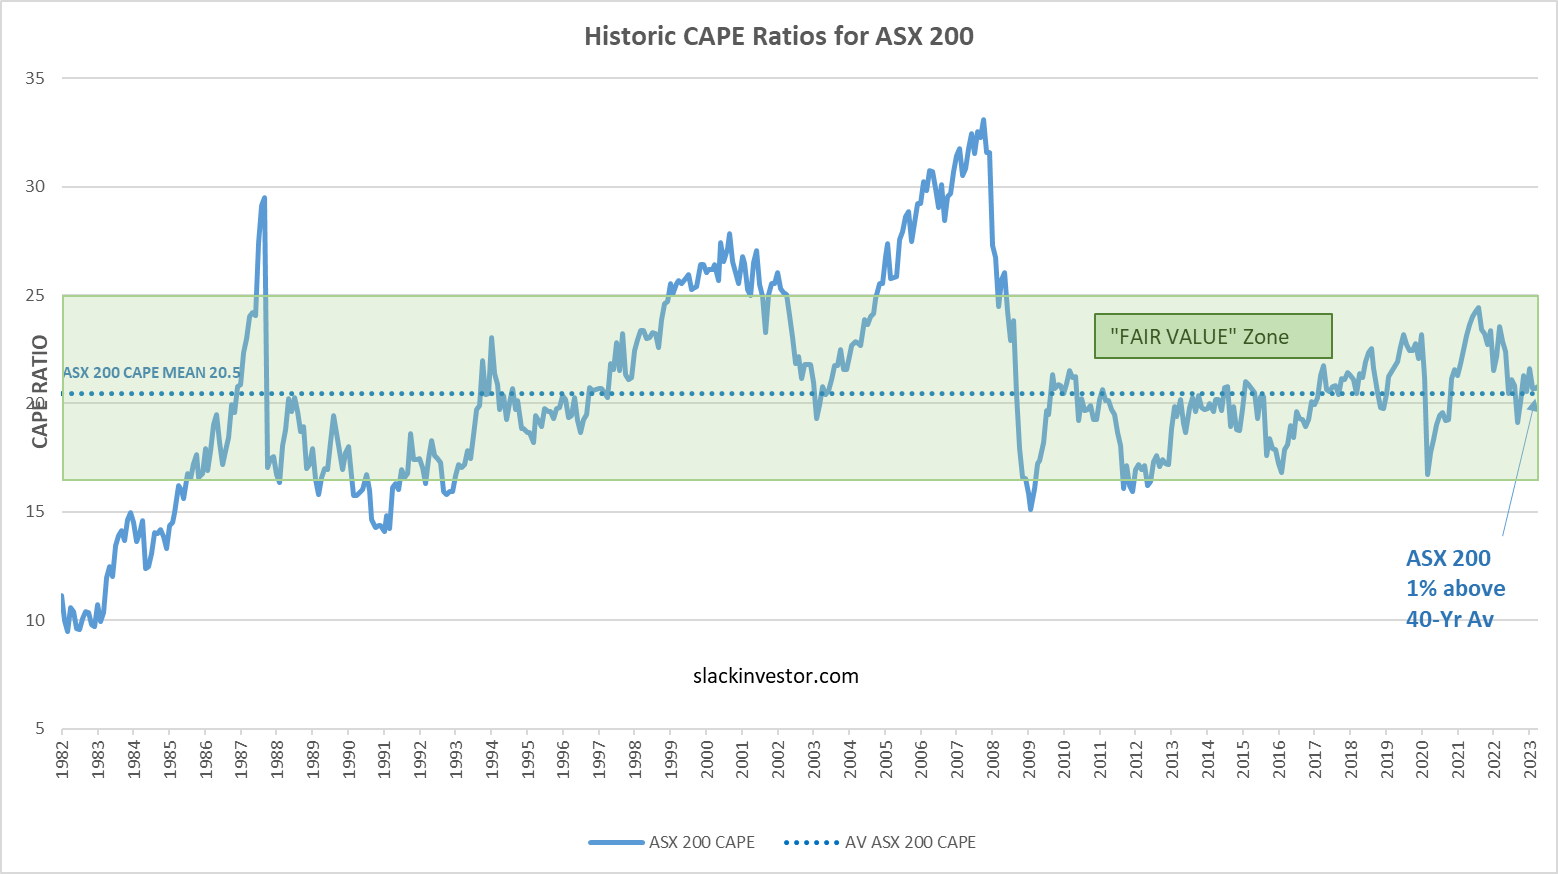
A few times a year, Slack Investor likes to take a snapshot of the markets using the Cyclically Adjusted Price to Earnings ratios (CAPE) which use ten-year average inflation-adjusted earnings. I first started using CAPE as a “value” tool in September 2021, and my most recent look was in May 2023.
By plotting this CAPE over a period of time, we can look at how the whole sharemarket is currently valued in terms of historical data – this way we can track the whole share market as it oscillates between overvalued and undervalued.
Using monthly CAPE data from Barclays, the 40-yr mean is calculated and plotted together with the CAPE values. A “fair value” zone is created in green where the CAPE is within one standard deviation of the mean (average).
ASX 200 Value
Historic CAPE ratios for the ASX 200 – From 1982 to end of October 2023– Click the chart for better resolution.
FTSE 100 Value
Historic CAPE ratios for the FTSE 100 – From 1982 to end of October 2023– Click the chart for better resolution.
S&P 500 Value
Historic CAPE ratios for the S&P 500 – From 1982 to end of October 2023– Click the chart for better resolution.
At the end of October 2023, both the ASX 100 (8% below the 40-yr average) and the FTSE 100 (15% below the 40-yr average) are “ON SALE”. If I have a choice, I will always look to buy in the sale period.
The S&P 500 still looks a little overvalued at 16% above the 40-yr average – but at least it has slipped back into the “Fair Value” zone.
In the world of stock markets, a 10% decline from a previous peak is known as a “Correction”. Never a nice time … but Slack Investor recommends that you just put on the big pants and get used to these things. Corrections are just part of the landscape of investing in shares and Slack Investor has often written about them – and theneed to roll with them – if you are using stock markets to better your financial position.
On average, the (US) market declined 10% or more every 1.2 years since 1980, so you could even say corrections are common.
Throughout my investing career, I have been a net buyer of stocks. Selling only to raise some cash, or to shift out of one stock into a (hopefully) better performing one. Things are much the same in retirement – Though I seem to be tradingless.
I have structured my portfolio into a stable income pile and the more adventurous investment pile. My living expenses are easily covered from the dividends from the investments pile and income from the stable pile. So I never have to sell shares when their value is discounted during a correction (>10% fall) or a crash (>20% fall).
This way I can reap the benefits of long term growth in the sharemarket. The data from 97 years of following the S&P 500 Index with a balanced (60% shares:40% bonds/cash) portfolio shows that, over a 5-yr period, the portfolio will outperform inflation 84% of times by an average annual amount of 5.48%. Holding the portfolio for 15 years, it has been ahead of inflation by 5.33% on 97% of occasions. Slack Investor would take those odds.
Not for the faint hearted, but you can (historically) get an increase to returns by taking on more risk with a 100% shares portfolio. When calculated over a 15-yr period, The S&P 500 has been ahead of inflation by 7.08% (average p.a.) on 95% of occasions.
In light of the above two tables, Slack Investor shows indifference to these corrections … be patient – you will be rewarded.
October 2023 – End of Month Update
Slack Investor remains IN for the US Index S&P 500 and the FTSE 100. But is on SELL Alert for the Australian index shares – as the end of month stock price (6780) is below its monthly stop loss of 6917.
Slack investor is on SELL Alert for the ASX200 at October 31, 2023 due to a stop loss breach. I have a “soft sell” approach when I gauge that the market is not too overvalued. I will not sell against the overall trend – but monitor my index funds on a weekly basis.
Another negative month for Slack Investor followed markets (S&P 500 -2.2 %, and the FTSE 100 -3.8%, and the Australian stock market did the same (ASX 200 -3.8%).
All Index pages and charts have been updated to reflect the monthly changes – (ASX Index, UK Index, US Index).
Sundar Pichai, the CEO of Google and its parent company Alphabet looks ready to play the “evil genius”.
At around 15% of my investments, Alphabet (US:GOOGL) is a major holding in my portfolio. It is my biggest international holding. I first dipped into the stock back in 2019 and have been trying to top up (in small amounts) each year since.
Since Larry Page and Sergey Brin launched Google in 2004 with a killer search engine, the many tentacles of Google/Alphabet have spread into the everyday life of billions. Youtube alone had 2.6 bn annual users in 2022.
(Google’s search and advertising) is Alphabet’s best business, accounting for 80% of Google’s total revenue in 2022 including Google Search and other properties like Google Network ads and YouTube. The remaining 20% comes from Google Cloud (9.4%) and its apps, hardware and content businesses (10.4%).
When the income chart looks like the above showing a track record of growth (prior to 2023) – and projected further growth up to 2025 – I’m interested. A look now at Slack Investors favourite finance indicators. A projected Return on Assets (ROE) of 24.5 in 2025 (well above 15%), a 2025 predicted PE ratio of 17.5 (very low for a growth stock), and plenty of cash on hand for further aquisitions – it all looks good.
Nitpicking
Despite admiring the skill of Alphabet management in aquisition and company growth, Slack Investor is notenamoured with everything this company does. There are some things that I find annoying. Back in 2017, they sudddenly dropped their popular Google Finance Portfolio feature. Slack Investor then migrated to Yahoo Finance to keep track of his portfolio. I note that Google Finance has recently reinstated its porfolio feature – but I have already moved.
To keep growing revenue, many of their channels are being further monetized. I love using Youtube for music, entertainment, and the millions of helpful “how to” guides. However, the ads at the start of the clips are tedious. This is an attempt to get people into Youtube (no ad) Premium at $13.99 per month.
I also had a recent battle to reduce the amount of data in my google account (Photos, Google Drive, gmail) to below the 15 Gb free limit. This is deliberatly not a simple process and seems to be designed to push people into more storage through a subscription starting at $2.49 per month.
These are relatively small quibbles though – and Slack Investor really doesn’t expect “something for nothing”. I continue to hold and a happy buyer of this company using an international e-broking account with CMC Markets – Alphabet, I hope, will be a very long-term holding.
The ruthless faces of the tax collectors depicted by Marinus Van Reymerswale do not ring true to Slack investor. These days, tax and fee collectors sit smugly behind desks as the fees and taxes roll in. Don’t get me wrong, Slack Investor is pleased to pay his fair share of tax … but excess fees for investing, that’s another story.
Most people have money in a super fund during their working life – this is normally known as an Accumulation Fund. When they retire, and the money can be released, they rely on this saved money to pay of debt – or fund their retirement. It is usual practice that you ask whoever runs your super fund when it is accumulating to also run your retirement fund – that pays you a pension at regular intervals.
For a fee, the super funds take care of the “back end” of this retirement fund – where your money is invested and all the administration for the fund. The Super provider sets up a new account within your super called an Account Based Pension (ABP). There is a great advantage in doing this as all earnings from from money transferred to this pension part of the fund are tax free if you are over 60. At 60, Slack Investor converted all of his accumulation funds into an Account Based Pension.
Naturally, Slack Investor is all for minimising these fees. Lets have a look at some of my favourite industry funds (Low cost high/performance) – Australian Super, Hostplus, UniSuper, and HESTA. Using the Chant West AppleCheck online tool available through the Australian Super site we can compare what they charge for running an accounts based pension.
For comparison, I invested our hypothetical ABP in the “conservative growth” option (21-40% shares) on all funds. This is usually the least risky of pre-mixed types of investments – and might be favoured by retirees. There are more other pre-mixed options that have better long-term performance – but these other options have more volatility. I have shown below the fees on a $550K account comprising of a $500 000 Account Based Pension together with a smaller $50 000 Accumulation account that you might have still running for any extra contributions.
FUND
10-yr Perf (%)
5-yr Perf (%)
Fees 500K Pension
Fees 50K Accum.
TOT Fees 550K
Australian Super
5.1
3.5
2602
322
$2924
HostPlus
4.7
2.9
3043
404
$3447
UniSuper
4.8
3.5
2696
356
$3052
HESTA
5.4
4.3
3152
362
$3514
The more you have … the more they charge.
Looking at just the cheapest of the above Industry Super providers, Australian Super with a pension account of $500K, $1m, and the current maximum amount for an accounts based pension $1.9m – again using the Chant West AppleCheck online tool.
Australian Super
Fees – Pension
Fees 50K Accum.
TOT Fees
$500K Pension Fund
2602
322
$2924
$1m Pension Fund
4802
322
$5124
$1.9m Pension Fund
8762
322
$9084
You could argue that these fees are reasonable, at around 0.5% of your invested funds, as there are inherent costs in investing and responsibly administrating these large amounts of money. Take the time to check what fees you are paying on your Super fund – and compare with a low cost/high performance fund using the AppleCheck tool – it might be time to switch funds!
Comparing Retirement fees with SMSF funds
Slack Investor is a great fan of the Self Managed Super Fund (SMSF) but recognizes that it is not for everyone – you must really be prepared to put a lot time and thought into the SMSF for it to be successful. To save on costs, rather than divesting responsibility to an accountant, Slack Investor uses a low-cost (no advice) provider and takes on a lot of the administration duties and investment responsibilities himself.
Unlike the Industry funds sliding scale for fees, a significant advantage in SMSF funds is that the costs are fixed – no matter what amount you have. For the 2023 financial year, Slack Investor’s costs through his provider eSuperfund were.
Task
Amount
Admin and Audit Costs (eSuperfund)
$1,330
Brokerage (10 trades)
$300
ETF Fees
$2,300
Time (50h@$50)
$2,500
TOTAL
$3,930
In the above example of annual fees, I have tried to include a charge for my own time at a nominal 50 hours at $50 per hour. On average, a hour per week. Most weeks I wouldn’t spend any time on my SMSF but, around tax time, and when making decisions about buying or selling, pensions, or contributions, I would spend a few hours thinking or researching. Annually, 50 hours is a fair approximation. I would gladly perform these tasks for free as finance is an interest and a hobby, but I’ve included them above to make a proper comparison – as not everyone is a Slack Investor.
Running an SMSF, because of their fixed costs makes more sense with a large super fund (>$500K). However, at the core of any successful self-managed fund (SMSF) is the amount of time and effort that the trustees (you, and other members of the fund) are willing to put into it.
Given the all the above data, it could be better, but the amount of fees that a good industry fund charges to run your pension seem reasonable at around 0.5% of funds under management. Slack Investor hopes that competition and transparency should gradually lower these fees.
September 2023 – End of Month Update
Slack Investor remains IN far all followed markets. The ASX 200 (-3.5%) and the S&P 500 (-4.9%) have had a poor month. However, the FTSE 100 is emerging from the doldrums with a positive month (+2.3%).
All Index pages and charts have been updated to reflect the monthly changes – (ASX Index, UK Index, US Index). The quarterly updates to the Slack Portfolio have also been completed.
The last time Slack Investor wrote about how he buys shares was two years ago, and The Slack Buying Process is worth a read for the detail. I must admit that not much has changed in the method that I use. Two of the shares that I bought back then Alphabet (US:GOOGL) and Betashares NASDAQ 100 (ASX:NDQ) have done OK in that time period, but Coles (ASX:COL) has lagged a bit, but because of dividends, is not on the losing pile yet.
Regardless of these preliminary two-year results, nothing fundamentally has changed for these companies and will stick things out for at least a 5-yr period – and then judge performance.
Since retiring, not much buying and selling goes on in my stable pile. For the investing pile, as I am now mostly a fully-invested “Buy and Hold” type of bloke, I don’t get to buy very often. The only opportunities come when I sell something, or my dividends build up beyond my living expenses.
The first thing to do is get a list of companies that you might be interested in. Slack Investor is an avid reader of the financial press. I get heaps of buying ideas from investment sites such as the AFR, Livewire, Morningstar, ShareCafe, InvestSmart, Motley Fool, etc. I pay particular attention when any articles I read mention “growth”.
Unlike when I am buying fish, for buying shares, I really want to look at the “guts” of a company. For this purpose, my best friend is the excellent Market Screener site. I type in the company name and then look at the Financials Tab. This gives me an overview of what the company has done and what analysts project that a company will do. There are lots of things to look at when evaluating a company – Management team, past performance, level of debt, projected sales, etc. However, if I could boil down a company to its essence with just two financial measures, it would be these two discussed below.
Return on Equity (ROE)
The ROE is usually expressed as a percentage and is the Companies
ROE = Stated Net Income/ Shareholder Equity.
For an instant way to look at whether a company is profitable, they will report a positive ROE. It is an indicator of how well the company uses shareholder funds. If I was getting a 5% return on my money in the bank, my ROE for that investment would be 5%. Obviously a high ROE is good. Slack investor likes his investments to have an ROE of at least 15%.
Sadly, the ROE can sometimes be manipulated by the management team by using a number of tricks. They might use accounting loopholes to distort earnings, or hiding assets off the balance sheet – both of these tricks will inflate the ROE.
As the denominator of the ROE equation is just shareholder equity, it ignores the effect of borrowings. Companies can boost their ROE by taking on large loans (risk). Also, a company with a large cash reserve (desirable for potential take-overs and share buy backs) will be penalised in the ROE calculation.
By screening out companies with large debt and including only companies with a track record of good management,- you can try to mitigate these risks in ROE calculation. Slack Investor is always looking forward, and he likes to use the Projected ROE of Future Income/Shareholder Equity.
Price/Earnings Ratio (PE)
The PE Ratio is defined as a companies share price to its earnings per share.
PE Ratio = Current Share Price/ Current Earnings per Share.
Slack Investor is usually looking at “growth” companies with a relatively high PE Ratio. A high PE ratio could either mean that a company’s stock is overvalued, or that there is an expectation that there might be high growth rates in the future.
A PE ratio is best used when compared against similar companies in the same industry or, for a single company across a period of time. Slack Investor usually gets the jitters when the projected PE Ratio is over the 40-50 mark.
Putting it all together
PE 2026
ROE % 2026
ASX
20
14
CPU
16
33
TNE
38
34
XRO
62
20
SEK
25
11
COH
38
23
RMD
18
22
I put all my possible “growth” stock buying options into a table and used Market screener Financials to get the projected (future) values for PE Ratio and ROE for 2026. I rejected XRO as it was too expensive (PE Ratio greater than 40) and ASX and SEK for low ROE ( <15%). TNE is a great company with good ROE and no debt, but slightly expensive (ROE 38). COH was also slightly expensive (ROE 38).
This left me with CPU (Computershare) and RMD (Resmed). Both good companies with good prospects. Lets have a look at the charts.
For now, Resmed (RMD) seems to be on a downward trend – and Computershare (CPU) on the up. The trend is your friend. This is not advice, but I bought some Computershare on the basis of the above analysis – slightly worried about the debt levels of CPU (which would tend to inflate the ROE), but I bought a small amount and will give this investment 5 years – then re-evaluate.
Whether it has been a good investing year – or a bad one, August is the time when the Vanguard long-term (30 yr) investing chart lands. It is a timely reminder that whatever is happening in the short term, investing for the long term (> 5-10 yr) in International and Australian shares will compound your wealth. Anyone with a steady income that exceeds their living expenses can do this – so, what a young Slack Investor would do, is Automate his investments, through platforms such as Stockspot, Pearler, Vanguard Personal, or Raiz) … and “Get Cracking!”
Extract from the 2023 Vanguard Index chart (Just the 2007-2023 portion) – the dollar values on the right are the results of investing $10000 in index funds in each asset class for 30 years (since July 1993) – Check out the full glory of the Vanguard 2023 chart in PDF format – Click image for better resolution.
The lessons of long term investing
Every year Vanguard publish their performance data on each asset class. Slack Investor looks forward to this – as it demonstrates the powerful compounding that happens when the appreciating asset classes of Shares and Property are held for a long time (30 years). Although this Vanguard collection of data shows the volatility of asset values in the short term – it also also emphasizes the joys of holding and accumulating shares or property for long periods of time. These asset classes have steadily increased in value over the last 30 years. $10000 invested in Australian Shares in 1993 would have compounded to $138 778 in 2023, US Shares would have compounded to $176 155. Staying in Cash would have yielded $34 737.
Slack Investor says download and study this chart … and work towards getting a mix of some appreciating assets … accumulate, then hang on!
Financial year total returns (%) for the major asset classes
In the Vanguard 2023 table below, for each asset class the total annual returns are given and the best performing class for each year is shaded in blue/green … and the worst in pink. What stands out to Slack Investor is that is rare for and asset class to lead in annual returns (blue/green) for two years in a row – and there are years where the leading asset class (blue/green) becomes the worst performer (pink) in the next year. This drives home the need to spread your investments over different asset classes (diversification) and stay the course – 30 years of data talks loudly to Slack Investor.
Total returns for each asset class for the 30 years since 1993 – Check out the full glory of the Vanguard 2023 Brochure in PDF format– Click table image for better resolution.
This table highlights the benefits of diversification across asset classes for the long-term investor. Each asset class might be the best performing (Blue/Green shading), or the worst performing (Pink shading) for the year – and might dominate (or languish) for up to two years in a row. However, often a worst performing asset will show up as the best performing asset in the very next year – or vice versa.
Slack Investor is accepting of the occasional negative returns on a yearly basis for the appreciating asset classes- and concentrates on the 30-yr average long-term annual returns for holding shares and property of over 9% p.a.
When averaged over 30 years, the asset class and annual returns are : For AUST. SHARES 10.0%; INT’L SHARES 8.7%; U.S. SHARES 11.6%; AUST. LISTED PROPERTY 9.0%; and INT’L LISTED PROPERTY 9.7%; This compares with the average cash return of 4.3% p.a.
Slack Investor knows where he wants to be … over the long term, it isn’t cash.
August 2023 – End of Month Update
Slack Investor remains IN for Australian index shares, the US Index S&P 500 and the FTSE 100.
All Slack Investor overseas followed markets had a negative month (S&P 500 -1.8 %, and the FTSE 100 -3.4% and the Australian stock market did the same (ASX 200 -1.4%).
All Index pages and charts have been updated to reflect the monthly changes – (ASX Index, UK Index, US Index).


